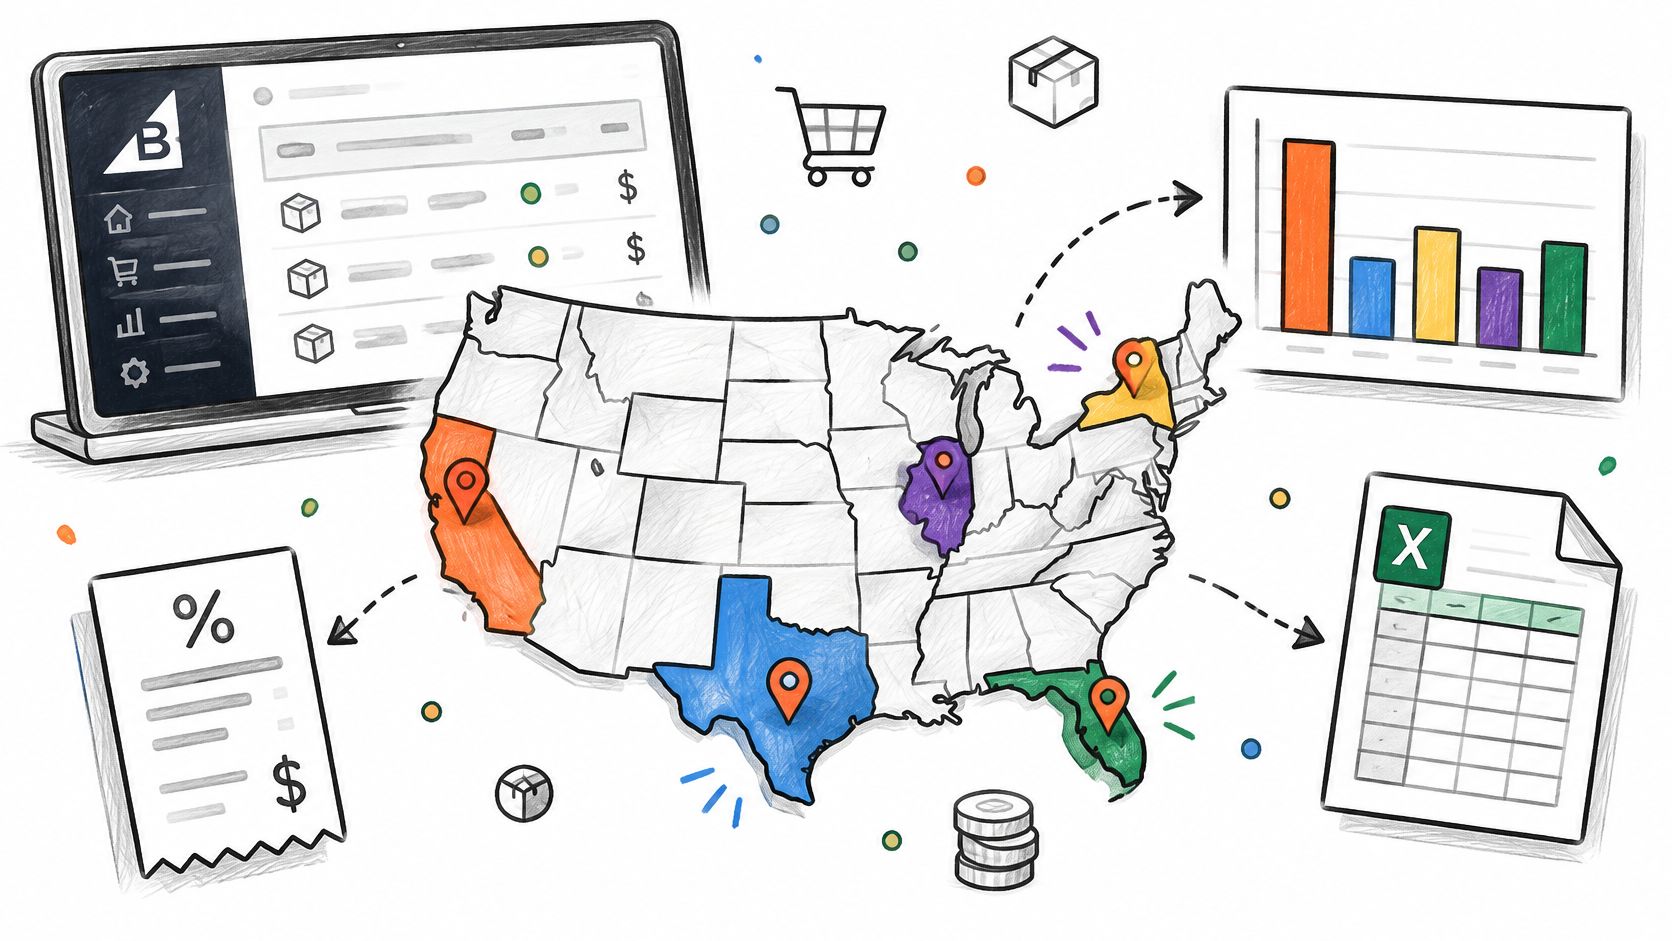
You need to answer a simple question for a monthly review, tax check, or regional promotion. Which states drove sales last month? You open BigCommerce, find order and tax detail, but you don't find a clean ranked list you can trust. That's the problem with BigCommerce sales by state. The data exists at order level, but address choice, refunds, discounts, and tax treatment decide whether your ranking is accurate or just tidy. Build the state view deliberately, reconcile it to store totals, and you'll get a report you can reuse.
Table of Contents
- Where BigCommerce Shows Sales by State
- How to Pull State Sales from Native Reports
- Metrics and Traps That Make State Rankings Misleading
- How to Assign Each Order to a State
- Tax Exposure Is Not the Same as Revenue
- Build Your First State Report This Week
Where BigCommerce Shows Sales by State
BigCommerce's native Orders Report and Sales Tax Report give you order level and tax level data. Neither produces a ranked list of states by revenue. Grouping orders by state takes an order export or a recurring analytics report, and our guide to BigCommerce order reports separates what native reports show from what custom views add.
Where to Find State Level Sales Data in BigCommerce
| Source | State data it gives you | Best for | Main limit |
|---|---|---|---|
| Orders Report | Order rows sortable by column, including Tax | Spotting high value and high tax orders | No state grouping or ranked state view |
| Sales Tax Report | Tax jurisdiction and rate recorded per taxed order | Tax collected by jurisdiction | Shows tax, not net sales by state |
| Order export file | Billing and shipping address fields per order | Custom pivots by state in a spreadsheet | Cleaning, refunds and tax basis are manual |
| Chartsy BigCommerce analytics | Regional comparisons in customer reporting | Recurring state questions in plain English | Share Links, Chartsy MCP and some other features are SaaS only |
Every row in that table stops short of a finished ranking. The export gets you closest, because it carries the address fields a pivot needs, but you still decide which address counts and how refunds reduce each state's total.
Don't use company wide figures as a shortcut. BigCommerce does not publicly disclose a complete sales by state breakdown for merchant GMV. The Commerce fiscal year 2025 results release reported approximately $31.7 billion in gross merchandise volume for fiscal year 2025, a 12% increase from fiscal 2024. That's a platform total, not your store's geography.
Define your terms before you rank anything. Gross sales means order value before discounts and refunds. Net sales means item revenue minus discounts and refunds, with tax and shipping shown separately. A shipping address shows where goods were delivered, while a billing address shows where the payer is recorded, and they aren't interchangeable. A ranking built on billing states can order states differently than one built on shipping states, so pick one basis and hold it across every period you compare.
Practical rule: Use native reports for a one off check. Build an export or recurring report when you need the same state view every month.
How to Pull State Sales from Native Reports
Native reports are useful for inspection, not for a finished state ranking. Work through them in order so you know exactly where they stop.
-
Check permissions first. You can't diagnose a missing report if your user account can't open it. The BigCommerce Orders Report guide states access requires both the Orders Report and Store Overview Report permissions, and the report sits under Analytics › Orders. For the Sales Tax Report, confirm you have Order Statistics plus either Store Overview Report or Carts Report permission before you start.
-
Set one complete month. Open Analytics › Orders and choose a full calendar month. A partial month makes a growing state look weak and makes month to month comparisons unreliable.
-
Sort by Tax. The order table can be sorted by column, including Tax. Sorting descending surfaces orders carrying the most tax, which gives you a first look at higher value orders and possible regional concentration, though it's not a state total.
-
Look for address fields. Check whether your version of the table displays shipping state or another address field you can group by. If no state column appears, don't force the report to answer a geographic question. Move to an order export or a custom report instead.
-
Open the Sales Tax Report for the same month. Compare the jurisdiction and rate recorded for taxed orders. This helps you understand tax collected by place, but tax collected is not net sales, and a high tax total may reflect rate or product taxability rather than demand.
Where Native Reporting Stops
Two gaps matter. Native revenue totals can keep a partially refunded order at its full value, and discounts are visible order by order rather than rolled into a state ranking. You'll also need order level exports if you want to separate direct store orders from other channels or examine product mix by state.
If part of your state demand comes from creator campaigns, it's worth separating content driven interest from completed checkout revenue, as explained in a guide to turning views into revenue from Social Cloud. Views don't belong in a sales by state table. Only completed, revenue bearing orders do.
Finish with a sanity check. Match the month's order count and headline totals against your store overview for the same window. If those don't align, fix the date range, permissions, or status filters before you draw any state conclusion.
Metrics and Traps That Make State Rankings Misleading
A state ranking built only on order count or gross revenue will mislead you quickly. Define every metric the same way for every state, then look at revenue quality, not just revenue size.
Metrics for Comparing Sales Across States
| Metric | How to calculate it | What to watch |
|---|---|---|
| Net sales | Item revenue minus discounts and refunds; tax and shipping shown separately | Keep the tax basis the same for every state |
| Refund rate | Refunded amount divided by gross sales for the state | Partially refunded orders keep their full total in native revenue |
| Average order value | Net sales divided by order count | A few large orders can distort small states |
| Units per order | Units sold divided by order count | Shows basket size, not revenue |
| Repeat-customer share | Customers with two or more orders divided by all customers in the state | Use the same date window for every state |
| Share of net sales | State net sales divided by total net sales | Recalculate after removing unknown geography |
Average order value, or AOV, tells you whether a state wins through many orders or larger baskets. Refund rate tells you how much of that apparent demand came back. Repeat-customer share shows whether buyers return, which a revenue only ranking hides completely. A state with modest net sales but strong repeat buying may deserve retention spending before a larger state driven by one off promotional orders.
Set a minimum order count before you rank states. Flag or suppress states below that threshold, because two unusually large orders can create a false winner with an impressive AOV and no reliable pattern behind it. Once a state passes your threshold, compare its discount rate as well. A state whose revenue depends on one promotion is weaker than it looks, and strong growth can conceal margin pressure from discounting, even though revenue alone never proves profit.
Refund treatment needs explicit handling. The BigCommerce guide to getting started with Analytics reports explains that orders with the Refunded status are excluded from order total and revenue metrics, but orders marked Partially Refunded retain their full order total in those metrics, including the refunded amount. Report refund amounts separately and keep each refund attached to its originating state. Separate order date from refund date too, so a late refund doesn't create an artificial drop in a later month.
Tax basis is another quiet distortion. Store whether revenue is tax inclusive or tax exclusive, then show tax exclusive net sales and tax collected side by side. Mixing the two makes states with different tax treatment look stronger or weaker for accounting reasons rather than customer demand. Flag cross border addresses separately, and decide whether your report uses shipping state or customer state before anyone asks a question such as "Show sales and refunds by customer state."
For a broader view of how custom views differ from standard dashboards, see our overview of BigCommerce analytics. The same discipline applies outside ecommerce reporting. Just as a report on call-driven SEO conversions from seopaslaugos.io separates calls from other conversion signals, your state report should separate net sales, refunds, tax, and repeat buying instead of collapsing them into one number.
Keep national market figures in their own lane. The U.S. Census Bureau ecommerce dataset provides market context, including U.S. retail ecommerce sales estimated at $310.3 billion in the third quarter of 2025, when ecommerce accounted for 16.4% of total U.S. retail sales. Those figures aren't BigCommerce sales by state and shouldn't be blended into your store ranking.
Could a team member explain your top three states without reopening the spreadsheet? If not, your metric definitions need work.
How to Assign Each Order to a State
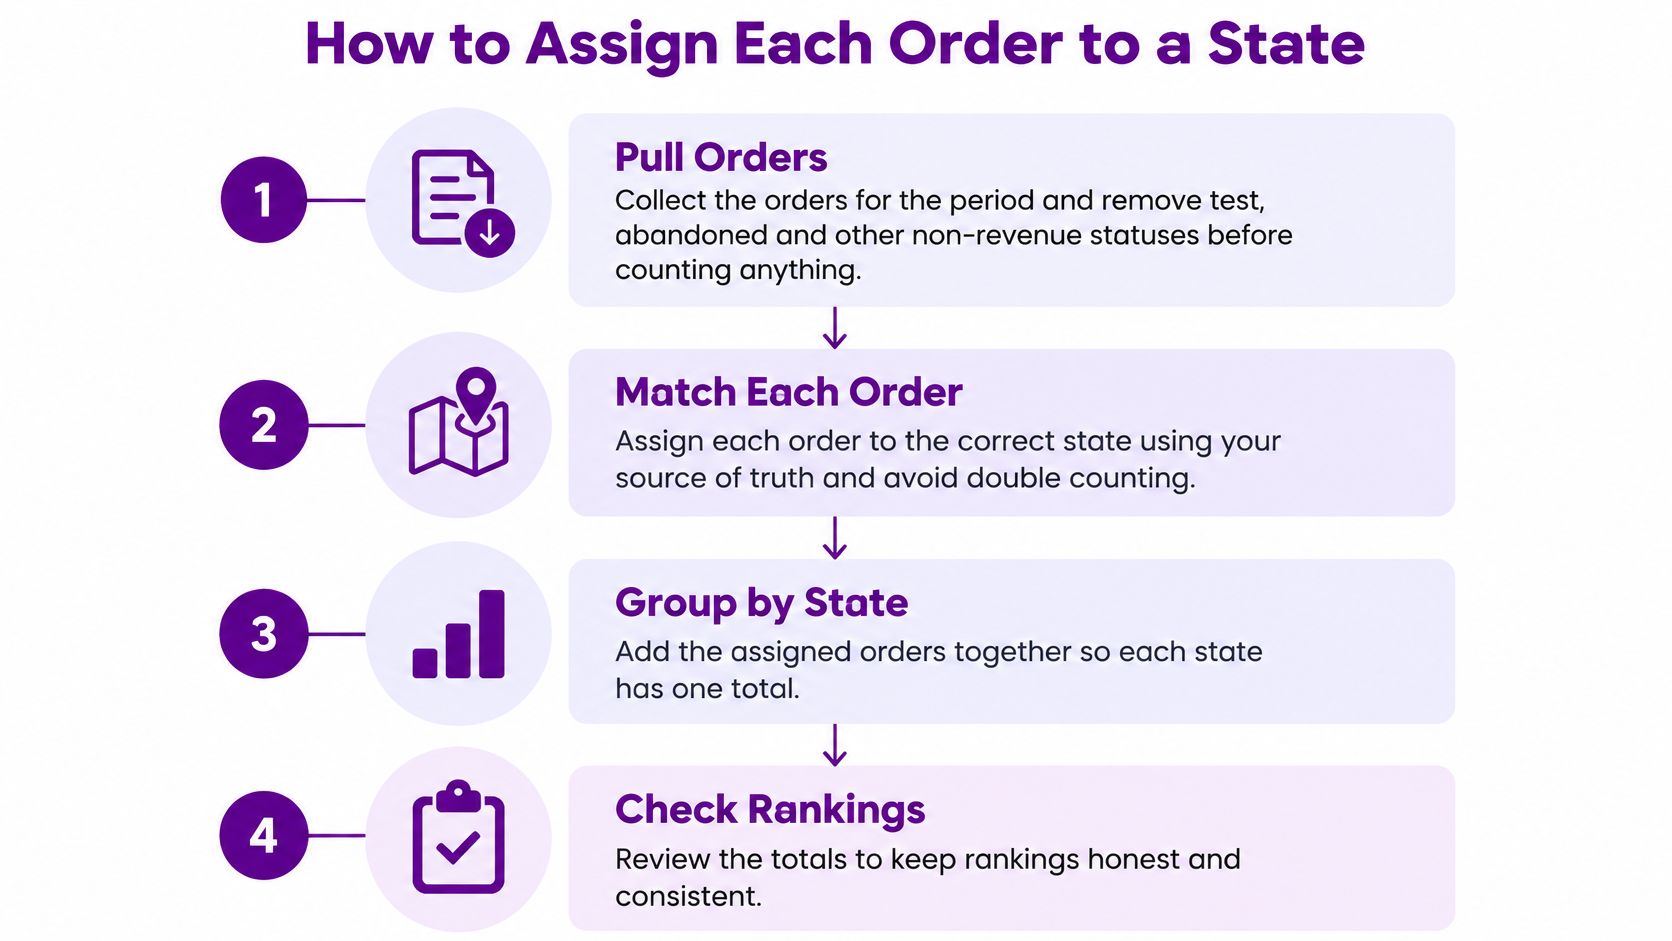
State totals are only as reliable as the address rule underneath them. Use shipping destination for physical orders, preserve the original address values, and reconcile every total before you publish a ranking. The flow below summarizes the assignment process before the detailed checks.
-
Pull orders and remove non revenue statuses. Exclude test, abandoned, and other non revenue orders before counting anything. This prevents checkout tests and incomplete carts from inflating a state.
-
Retrieve every shipping address record. One order can ship to several destinations, so don't stop at the first address row. The BigCommerce Orders API address documentation distinguishes a required billing address from separate shipping addresses, which can be multiple.
-
Assign physical orders to shipping state. Use the normalized shipping destination rather than the billing address or customer profile. Put digital orders with no shipping address into a separate digital or unknown geography group. A missing address there is expected, not automatically an error.
-
Standardize state and country together. Normalize state or province codes against a controlled reference table and keep the country code beside them. Without country context, CA can collapse Canada and California into one false state total. Preserve original values for auditability.
-
Allocate multi destination orders at line or shipment level. Assigning the entire order to the first address materially distorts rankings when items ship to different states. Split item revenue, discounts, and units according to the lines in each shipment.
-
Aggregate the full financial picture. For each state, total gross sales, discounts, refunds, tax, shipping, net sales, orders, and units. Don't publish net sales without showing the components that produced it.
-
Reconcile and publish coverage. State totals must sum to the store wide ledger for the same period and status rules. Publish valid state attributed net sales divided by total net sales, plus the unknown geography rate.
The short walkthrough below is useful when you're checking how order records connect before you build the recurring version described in our guide to BigCommerce custom reports.
Run one monthly test. If coverage drops, check recent changes to address collection, digital product mix, and export fields before you blame regional demand.
Tax Exposure Is Not the Same as Revenue
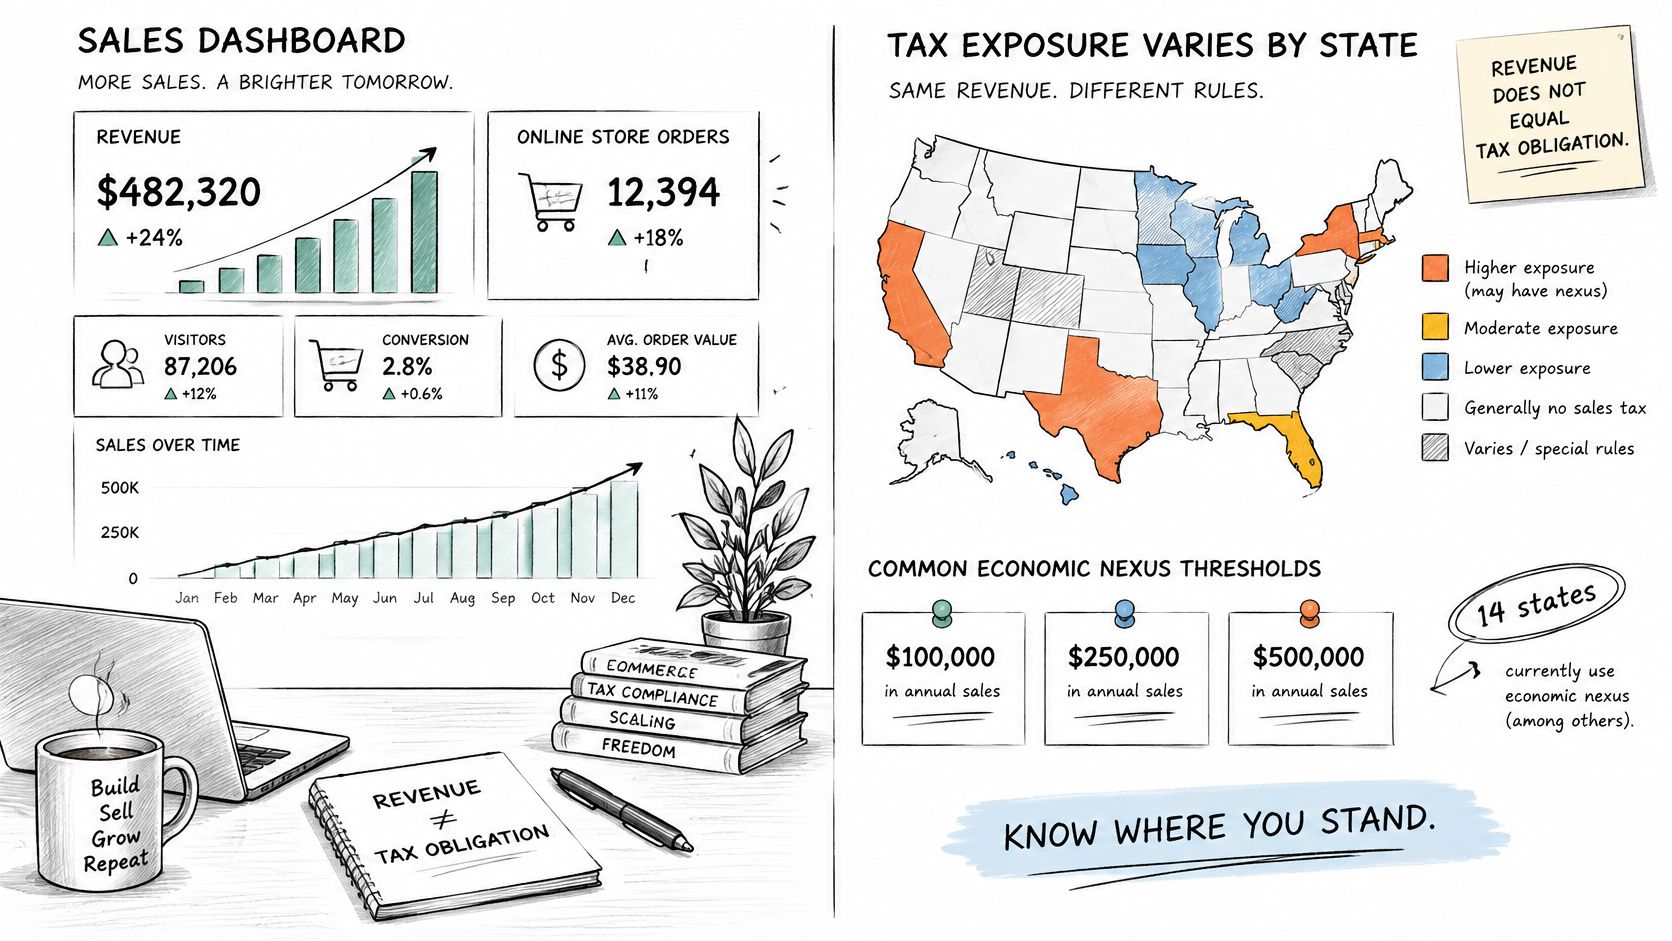
Your highest revenue state isn't necessarily your highest risk state. Economic nexus rules set different sales thresholds, transaction tests, measurement periods, and marketplace treatments, so a smaller state can create an obligation sooner than a larger one. A ranking that sorts by revenue alone will point your attention at the wrong places.
The image below frames the distinction you need to keep visible. Revenue performance and tax exposure belong in related reports, and they answer different questions.
Economic Nexus Sales Thresholds by State Group
| State group | Sales threshold | Transaction test |
|---|---|---|
| Most states | $100,000 | 200 transactions |
| Alabama | $250,000 | 200 transactions |
| California | $500,000 | Removed January 1, 2025 |
| New York | $500,000 | 200 transactions |
| Alaska | $100,000 | Removed January 1, 2025 |
Thomson Reuters sales and use tax guidelines for ecommerce retailers state that most states use a $100,000 threshold, Alabama uses $250,000, and California and New York use $500,000. The same guidelines state that 14 states, including California, removed the former 200 transaction test beginning January 1, 2025.
Track exposure as its own workflow. Pull jurisdiction and rate per taxed order from the Sales Tax Report, then build year to date taxable sales by state with gross sales, refunds, and order counts beside it. Measure each state's distance from its threshold as a share of that threshold, so the states closest to crossing surface first regardless of their revenue rank. Split marketplace orders from direct store orders, because states differ on whether marketplace sales count toward the threshold. BigCommerce is your storefront and does not act as a marketplace facilitator for your direct store sales, so marketplace treatment does not apply there.
Check the measurement period too. A state that measures a completed year behaves differently from one that measures a trailing window, and that changes when an obligation begins even where the dollar threshold is identical.
A question such as "Which states are within 20% of a nexus threshold after refunds?" earns its place only after you have confirmed the state, taxable sales, refund, and channel fields behind it. When you move those figures into accounting, avoiding QuickBooks sales tax filing mistakes from Bookkeeping and Accounting of Florida Inc. is a practical reminder to keep setup and filing records aligned.
Treat this view as planning and early warning. Have a qualified tax professional confirm your position before you register, start collecting, or conclude that no obligation exists.
Build Your First State Report This Week
Start with one report you can verify line by line. Don't begin with a permanent dashboard, a map, or a twelve month ranking.
-
Choose one unanswered question. For example, ask for net sales by shipping state last month, with refunds and tax shown separately. That scope is small enough to reconcile and specific enough to expose definition problems.
-
Check the current offer before connecting your store. Our BigCommerce Pro plan has a 14-day free trial with no credit card required, and can be cancelled anytime. Confirm current terms before you rely on them for a reporting project.
-
Ask in plain English, then audit the answer. We let users ask questions in plain English and get charts instantly, but you still need to confirm the state field, net sales basis, date window, and unknown geography rate. A fast answer with the wrong address field is still wrong.
-
Compare against BigCommerce for the same window. Match total orders and net sales to your store overview, then inspect one state you know well at order level. Check a partially refunded order and a digital order if your store has them.
-
Repeat the identical question next month. Use the same definitions and status rules. We track revenue and product performance at store, category, product and SKU levels and export to PDF or PNG, which helps when you later expand the state view into product or category questions.
Decision rule: Keep the view if its totals reconcile to your store. Rebuild the state field if they don't.
Build your first reconciled BigCommerce sales by state report with Chartsy, ask for net sales and refunds by shipping state in plain English, and verify the result against your BigCommerce totals for the same month. Once the state field, refund treatment, and unknown geography rate check out, save the question as your recurring monthly view.

Written by
Chartsy TeamAnalytics team at Chartsy
The Chartsy Team writes guides, product updates, and resources to help SaaS and eCommerce founders make sense of their metrics, without SQL or spreadsheets.
Chartsy