
You need last month's sales number for a supplier call, so you open your store, check one report, then an export, and get two different totals. Neither looks wrong on its own. One counts every order you can see, the other seems to leave some out, and a refund you issued two weeks later does not appear in either total the way you expected.
That mismatch is the usual problem with BigCommerce order reports. The same order can read as one order in a count, part of gross sales, a smaller net sales figure, and a different amount after a refund. Once you know which field is which, and which statuses a report is counting, the numbers stop arguing with each other.
Table of Contents
- Order Report Fields at a Glance
- How to Open the Orders Report in BigCommerce
- Gross, Net and Refund Terms Defined
- Order Counts, AOV and Status Rules
- Refunds, Migrated Orders and Currency Totals
- Comparing Sales by Period, Product and Variant
- Customer Purchase Patterns from Order History
- Native Reports, Exports and Third-Party Tools Compared
- Run Your First Order Report This Week
Order Report Fields at a Glance
Start from the row, not the total. In the native Orders report, each row is one order, not one product, so a customer who bought three items still appears as a single transaction you can trace from placement to payment.
The BigCommerce Analytics reports guide describes the Orders Report as a transaction-level view of every order placed on a store, accessed through Analytics › Orders, with each row carrying a unique order ID, creation date, order-channel attribution, subtotal before discounts, line-item discounts, order-level discounts, shipping, tax, and total. You will not see it at all unless your account has both Orders Report and Store Overview Report permissions enabled.
| Field | What it holds | How to use it |
|---|---|---|
| Order ID | Unique identifier for each order | Trace one order across reports and refunds |
| Creation date | When the order was placed | Set the period for the report |
| Order channel | Where the sale was attributed | Compare storefront and other channels |
| Subtotal before discounts | Item prices before any promotion | Measure gross merchandise value |
| Line-item discounts | Promotions on specific products | Measure product-level promotions |
| Order-level discounts | Cart-wide promotions | Measure cart-wide promotions |
| Shipping | Shipping charged to the customer | Keep out of merchandise revenue |
| Tax | Tax collected on the order | Keep out of merchandise revenue |
| Total | Final amount for the order | Compare with payments and refunds |
Why the splits matter
Keeping line-item discounts separate from order-level discounts tells you whether a promotion discount moved a specific product or reduced every cart that used a code. Those are different merchandising decisions, and combining them hides which one you paid for.
Separate shipping and tax fields stop you from reading delivery charges and collected tax as merchandise revenue. If you sum the total column and call it sales, you'll overstate what products earned and then wonder why payout and inventory figures do not line up.
Before you trust any summary, pick three orders and add the parts by hand. Subtotal, minus both discount types, plus shipping and tax, should reach the total, and any gap points to rounding, a tax setting, or a later refund.
That five-minute check also gives you a baseline for product breakdowns, discounting, and average order value (AOV). If the row does not reconcile, no dashboard built on top of it will reconcile either.
How to Open the Orders Report in BigCommerce
If the report is missing from your menu, don't assume the store has no order data. Permissions cause that problem more often than missing sales do.
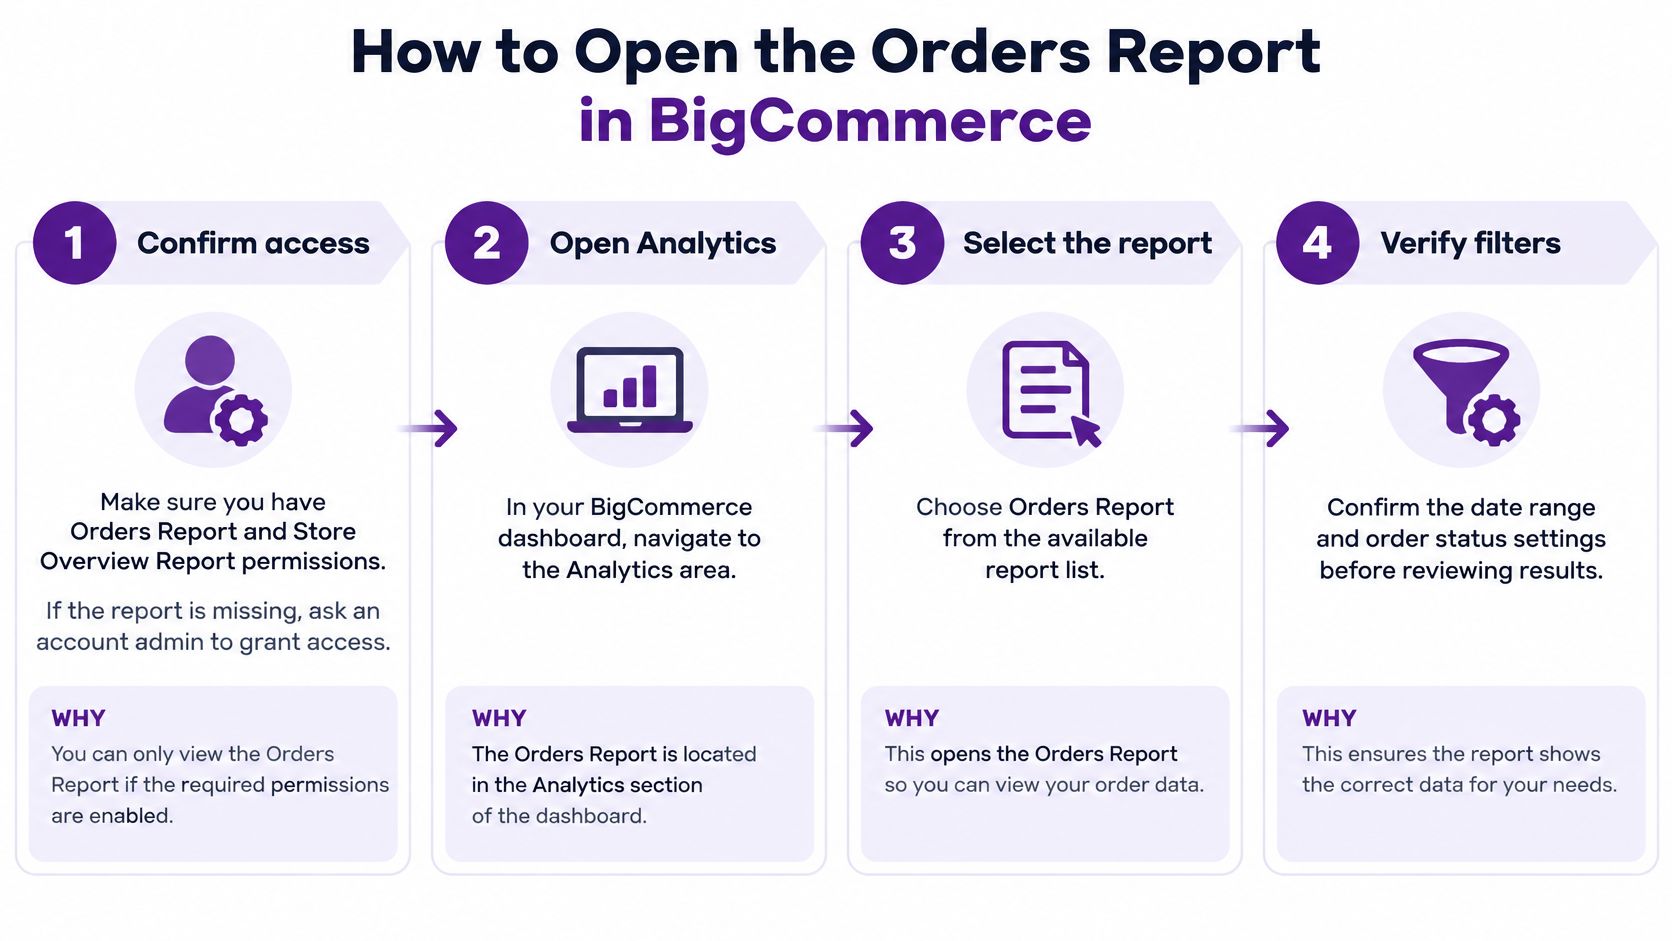
Steps to a repeatable run
- Confirm access: Ask an account admin to check that your user has Orders Report and Store Overview Report permissions. Without both, you'll waste time looking for a report you cannot open.
- Open Analytics › Orders: Go to the Analytics area and select Orders. That's the native transaction-level view, not an order export and not a summary dashboard.
- Set the date range first: Choose the period before you read a single total, so every figure on screen covers the same dates. Changing dates halfway through is how mismatched comparisons start.
- Check the statuses being counted: Order counts depend on which statuses are eligible for inclusion. Note the statuses in use, because a later run with different statuses will produce a different count for identical dates.
- Open one order and compare it: Click through to the order page and match subtotal, discounts, shipping, tax, and total against the report row. One verified row tells you more than an hour spent debating a store total.
- Record your settings: Copy the period totals into your working file together with the date range and status rules you used. A number without those notes cannot be repeated next month.
Clean run test: One row per order, report figures that match order detail, and a written note of the included statuses. If any of those three is missing, fix the setup before you share totals.
Gross, Net and Refund Terms Defined
Most reporting arguments aren't math problems. They're vocabulary problems, with two people using the word sales for different amounts.
- Gross sales: Item prices before any discount, excluding shipping and tax. It's your starting merchandise value before promotions take anything away.
- Discounts: Reductions at the line-item or order level. They explain the gap between listed price and what the customer was charged for products.
- Shipping: Money charged for delivery. It passes through to carriers in spirit, even when the amounts don't match exactly, and it isn't product revenue.
- Tax: Collected for a tax authority. It was never your income, so counting it inflates performance.
- Refunds: Money returned after a sale. The original order total doesn't show them, which is why a paid total can survive unchanged while realized revenue falls.
- Net sales: What remains after discounts and refunds. Teams define the edges differently, so I would pick one definition, write it down, and refuse to drift.
- Order total: What the customer paid, including shipping and tax.
- Profit: Revenue minus product cost, fees, and other costs. An order report holds none of that cost data, so it can't tell you which product is profitable.
| Term | Meaning | Shown in the order report? |
|---|---|---|
| Gross sales | Item prices before any discount, excluding shipping and tax | Yes, as subtotal before discounts |
| Discounts | Reductions taken at line-item or order level | Yes, as line-item and order-level discount fields |
| Shipping | Delivery charge paid by the customer, not product revenue | Yes, as its own field |
| Tax | Collected for a tax authority, not your income | Yes, as its own field |
| Refunds | Money returned after the sale | Not in the original order total; check refund records |
| Net sales | What remains after discounts and refunds | No single field; calculate from order fields and refund records |
| Order total | Amount the customer paid, including shipping and tax | Yes, as total |
| Profit | Revenue minus product cost and other costs | No; the order report holds no cost data |
One order through every term
Take a clearly hypothetical order. Items total $100, a line discount takes off $10, shipping adds $5, and tax adds $8, giving an order total of $103.
If you later refund $20 on the item, net sales excluding shipping and tax fall to $70. Gross stayed $100, the customer once paid $103, and net is $70. All three numbers are correct, and they answer different questions.
Order Counts, AOV and Status Rules
Two reports covering the same month can show different order counts without either being broken. The reason is usually status selection.
Order counts follow eligible statuses, not every record stored for the store. Add a status your team normally excludes, and volume rises while every rate built on that count shifts underneath it.
AOV needs a named numerator
AOV equals sales divided by number of orders. The formula is simple, and the trap sits in the word sales. State whether you're dividing gross sales, net sales, or order total, because each choice produces a different AOV from the same orders.
If you want the standard definition before you set your own reporting rule, our AOV metric breakdown covers how the calculation is framed. Your report header should still say which sales definition you used.
Use a labeled hypothetical to see the status effect. With 200 eligible orders totaling $24,000, AOV is $120.
Now include 15 orders totaling $1,500 in a status your team does not want. The count becomes 215, the total becomes $25,500, and AOV falls to about $118.60, even though no customer bought anything different.
Two rates from the same fields
- Discount rate: Discounts divided by gross sales, showing how much listed value promotions consumed.
- Refund rate: Refunds divided by gross sales, showing how much sold value came back.
Both rates only mean something across periods when the inputs stay consistent.
Use the same statuses, date range length, and sales definition in every period you compare, and write all three at the top of the report where a reader cannot miss them.
I would treat any AOV movement as unexplained until status inclusion is checked. A falling AOV caused by counting extra low-value orders calls for a reporting fix, not a pricing meeting.
Refunds, Migrated Orders and Currency Totals
Clean fields can still produce a misleading period total. Three quiet exceptions account for most of the damage.
First, historical imports do not behave like live orders. The BigCommerce Orders overview for developers documents that importing an order with external_source code M-MIG excludes it from the store's GMV and order count and does not deduct inventory. That protects current metrics from backfilled history and protects present stock from old sales.
If your analysis needs migrated history, add it as a separate, clearly labeled source. Don't expect it inside current totals, and don't add it in a spreadsheet where nobody can see the adjustment.
Second, currency is part of the order, not formatting. Multi-currency records distinguish the transactional currency the shopper paid in from display currency, and they can carry the store-default currency and applicable exchange rate.
Don't add totals in different currencies as if they're one amount. Convert each order to one reporting currency using a recorded rate, keep the original currency on the row, and note the rate source in the report header. A single blended total with no lineage looks precise and tells you nothing you can audit.
Third, refunds sit outside the original total. Transaction and refund records are separate from the order itself, so a heavily refunded period can look untouched if you only read order totals.
Pull refund records for the same period before you report net sales. For a dedicated walkthrough, see how a BigCommerce refund report separates returned money from sold value.
Pre-send habit: Reconcile one refunded order and one migrated order by hand. Confirm subtotal, discounts, shipping, tax, refund, and converted total all agree with order detail before a client or teammate sees the period.
Comparing Sales by Period, Product and Variant
A store total can stay flat while the products underneath change completely. Comparison reporting exists to find that movement.
The visual below shows the kind of period and product view merchants check before they change pricing or stock.
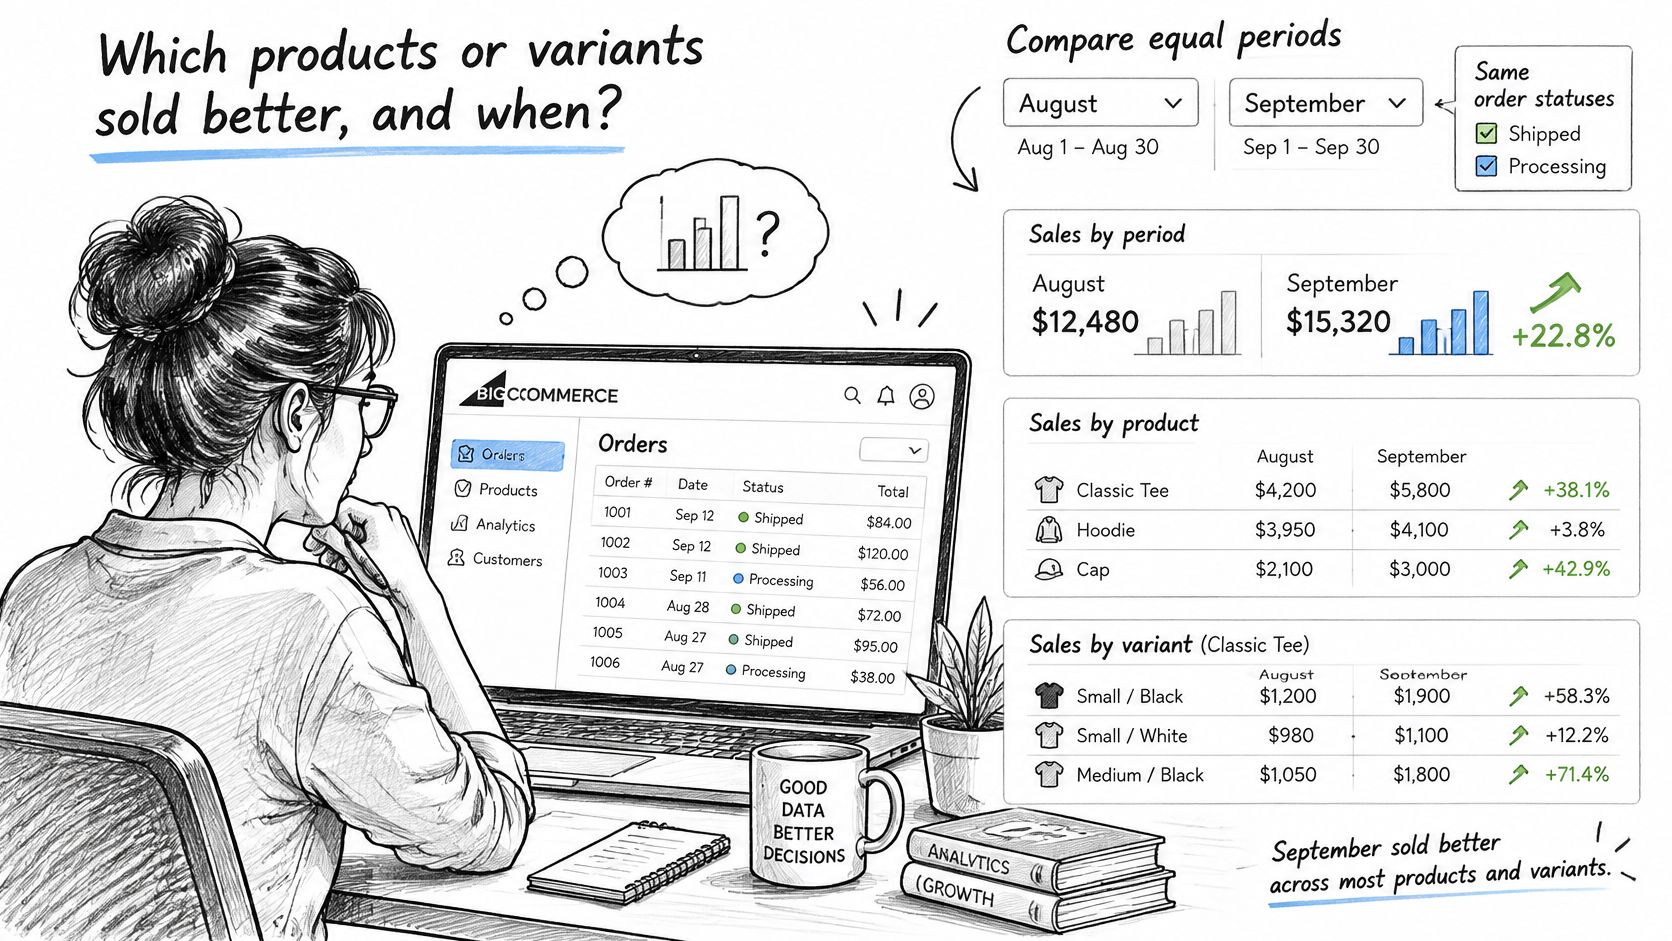
Start with a specific question and equal setups. Pick two periods of the same length, such as September against August, with identical statuses, then compare by SKU first. A SKU is the stock-keeping unit that identifies a specific purchasable item, and it's the level where a sales change occurs.
Move from SKU to category to variant
Roll SKUs up to category once you know which items moved, because category totals are useful for range decisions but poor at explaining cause. Then split variants, such as size or color, where product options influence buying. A variant is one option combination of a product, and shoppers often switch between variants without leaving the product at all.
Consider a labeled hypothetical candle. The base SKU sells 120 units in August and 90 in September, while a scented variant rises from 30 to 55. The category total moves modestly, yet buying clearly shifted between variants, which changes what you reorder.
Building that SKU-by-month view natively usually means exporting order lines and grouping them yourself. In Chartsy, you can ask in plain English, for example, "Compare September and August sales by SKU," or "Show monthly sales by category, including discounts and refunds," and review the resulting table against your native totals.
This short video works through the same style of question, which is useful for seeing how a request becomes grouped output.
For a monthly category report, add discount and refund columns to every category row. That way, a category that wins on gross but loses on returns cannot hide behind the store's net sales definition, and both periods reconcile before you call a change real.
Customer Purchase Patterns from Order History
Order history becomes customer reporting when you group orders by the person or account who placed them. For each customer over a chosen period, you can calculate order frequency, total spend, first purchase date, and most recent purchase date.
Define groups you can state in one sentence, using dates and counts your team can reproduce.
- New in the period: The customer's first order falls inside the selected period.
- Returning: The customer ordered inside the period and also ordered before it.
- Repeat buyers: The customer placed two or more orders in the year.
- Lapsed: The customer has not ordered for a set number of days your team chooses, for example a hypothetical 90-day threshold.
Add geography when fulfillment or regional demand matters. Grouping sales and refunds by customer shipping state answers questions like "Show sales and refunds by customer state" and shows where repeat orders concentrate.
Define your own labels
Don't assume BigCommerce provides built-in behavioral labels such as Loyalists or At-Risk in native order reporting. If you want segments, define the rule yourself, record the threshold, and keep it stable across periods.
For more approaches built from order history, see these BigCommerce customer reports. In Chartsy, a merchant question such as "Which customers made more than one purchase this year?" or "Which product variants generated the most net sales last month?" can apply your stated grouping without a fresh spreadsheet build.
Put group definitions in the report title itself, not in a separate note nobody opens. "Repeat buyers, two or more orders in 2025" travels with every screenshot and export.
Native Reports, Exports and Third-Party Tools Compared
Choose based on how often you'll repeat the job, not on how impressive a dashboard looks in a demo.
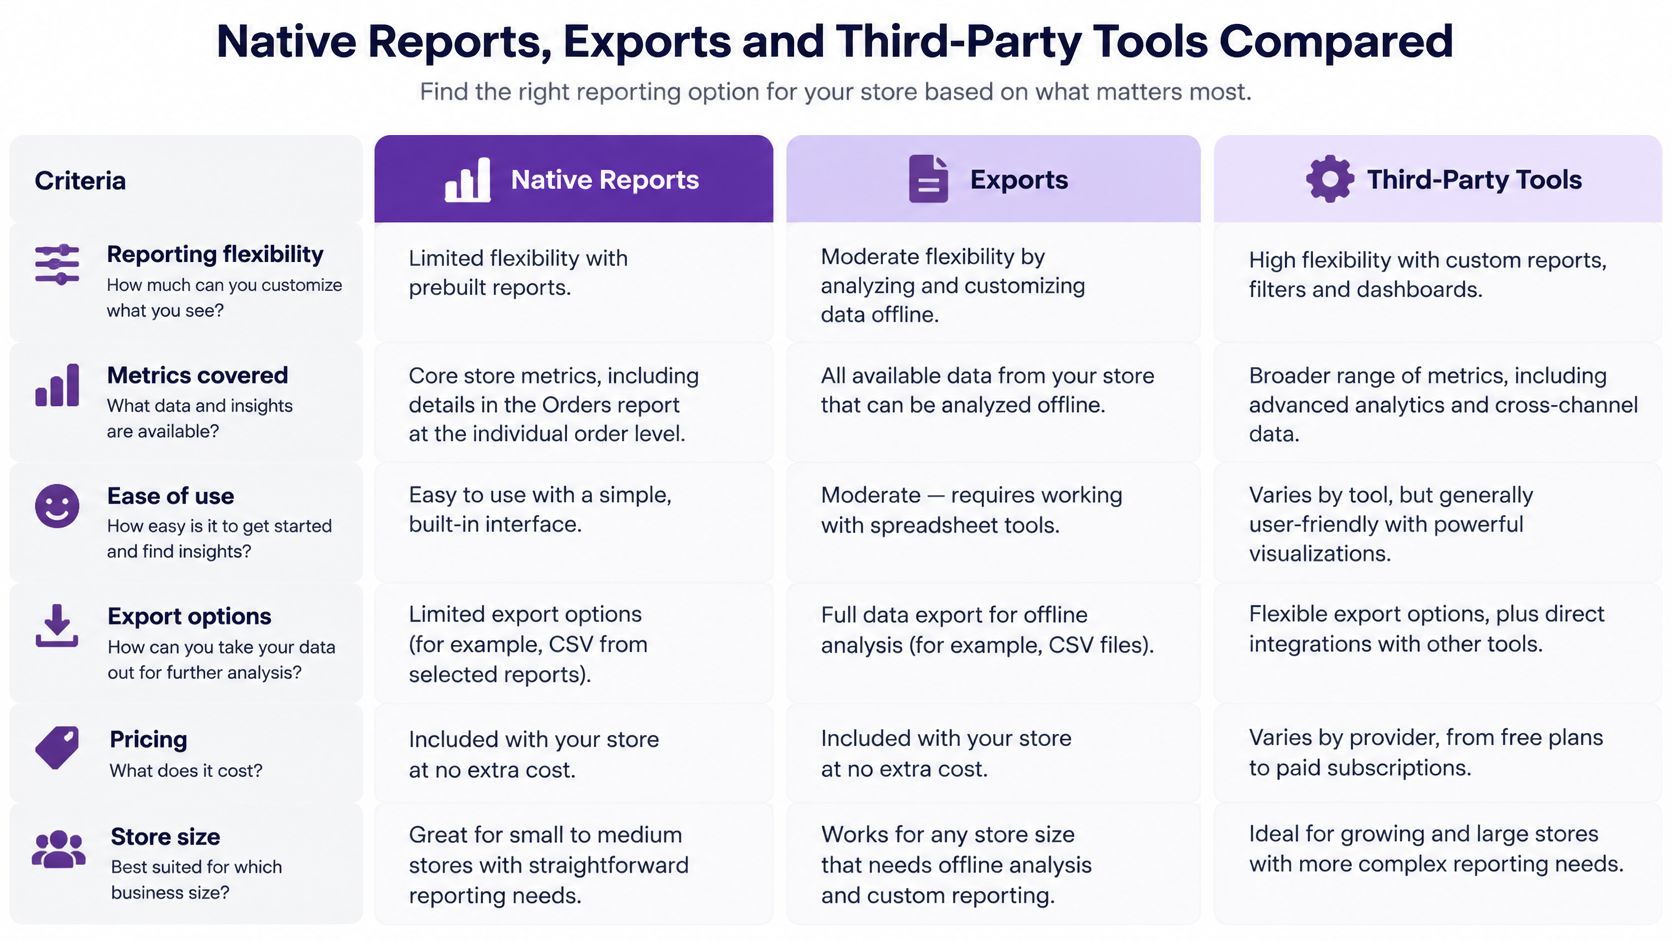
| Option | Best for | Trade-off | Pricing |
|---|---|---|---|
| Native Orders report | Checking individual orders and period totals | Fixed view with limited custom grouping | Included with BigCommerce, subject to your plan |
| Spreadsheet on order exports | Full control over columns and formulas | Manual exports and upkeep; errors around refunds and statuses | Existing spreadsheet software |
| Chartsy BigCommerce analytics | Plain-English questions, custom reports, SKU and customer views | Third-party connection; check its metric definitions against yours | Starts from $19 per month |
| Other reporting apps | Teams with specific metrics or workflows | Fit and cost vary; check supported metrics and exports | Set by each provider, check before buying |
The native report is enough for a single check, and it's your best verification source either way. A spreadsheet suits one-off analysis with custom accounting logic or a store with very few orders, but every repeat costs manual effort and invites status or refund errors.
A dedicated tool suits teams that rebuild the same views weekly, provided you compare its definitions with yours first. If you're still choosing store software rather than reporting add-ons, online store software picks from Rankozo give useful context on where BigCommerce sits among platforms. Check current pricing and export options for any app before deciding, since terms change.
Run Your First Order Report This Week
Pick one question your team asks every month. A good starter is "Which product variants generated the most net sales last month?" because it forces you to use variants, discounts, and refunds in one answer.
Answer it first in the native Orders report. Write down the date range, statuses, and sales definition you used, and verify three orders against order detail.
Then ask the same question in Chartsy and compare totals for the identical period. Our BigCommerce analytics tracks revenue and product performance at store, category, product, and SKU levels and exports to PDF or PNG, starting from $19 per month. The BigCommerce Pro plan offers a 14-day free trial with no credit card required, and it can be cancelled anytime.
Only rely on the second tool after its totals match the native report for at least one period you've checked by hand. Your first action is small. Open the Orders report today, pull last month, and compare three orders.
If your recurring BigCommerce order reports still start with an export and an hour of grouping, Chartsy lets you ask questions in plain English and build custom sales, product, customer, and order reports from your store data. Start with one monthly report, the variant net sales question above, and verify its first output against your native Orders report before you roll it into a weekly routine.

Written by
Chartsy TeamAnalytics team at Chartsy
The Chartsy Team writes guides, product updates, and resources to help SaaS and eCommerce founders make sense of their metrics, without SQL or spreadsheets.
Chartsy