
You pulled last month's category ranking and it looks clean. Apparel is ahead, home is flat, and someone wants to reorder the leader. That ranking is probably not BigCommerce sales by category in a form you can defend in a meeting. A product can sit in two categories, a partial refund can still count as a full order, and the revenue column may already include tax.
Before you change a buy or a promotion, pin down the grain of the report, write a definition of net sales, and pick a rule for products that belong to more than one category. Native BigCommerce reports answer product and order questions well. Category totals are something you assemble, then check against the orders they came from.
Table of Contents
- Choose the Report That Answers Your Category Question
- Define Gross, Net and Units Before You Compare
- How to Build Category Totals Without Double Counting
- Handling Refunds and Late Returns in Category Reports
- Reading Category Sales Beyond the Revenue Ranking
- Run Your First Category Report in Chartsy
Choose the Report That Answers Your Category Question
BigCommerce's documented reports work at order, product, and variant level. A category question usually means taking product rows and grouping them yourself, or using a tool that already groups them. The four routes below are not interchangeable.
| Report or source | Grain | What it covers | Best for |
|---|---|---|---|
| Orders Report | Order and line item | Eligible orders, units sold, revenue, share of discounted orders, average order value | Order-level discount and AOV checks |
| Merchandising Report | Product and variant | Revenue, order count and quantity sold by product or variant in a date range | Finding which products sit inside each category |
| Order export | Order and line item | Raw order rows you join to product and category data | Custom category totals with your own rules |
| Chartsy for BigCommerce | Store, category, product and SKU | Sales and product performance by category, product and SKU; confirm current export options | Repeating category comparisons once your mapping is verified |
The Orders Report is the right place when the question is about orders, not shelves. For a selected period it shows eligible orders, units sold, revenue, the share of orders discounted at the order level, and average order value (AOV). It will not tell you which category earned the money.
The BigCommerce Merchandising Report is the easiest start for “which products sit in this category.” It compares revenue, order count, and quantity sold for each product or variant in a date range. Merch Revenue is the line-item sale price after order-level discounts, multiplied by quantity. Product prices include tax. Shipping, taxes not already in the product price, and order-level discounts are handled separately in that metric. That grain beats a store-wide total when you need the items driving a category, but it still is not a category total.
An order export gives line-item rows you can join to category membership in a spreadsheet. That is the route when you need your own attribution rule. It is also the slow route if you rebuild it every month.
A reporting tool such as Chartsy for BigCommerce can group sales by category, product, and SKU (the stock-keeping unit that identifies a specific item). Use it for a repeating comparison only after the mapping matches a reconciled export. If you are still learning what an order total includes, the guide to BigCommerce order reports is the cleaner starting point than a category dashboard.
Open each report in your admin and set the date range before you read a total. Menu paths change, so check them against current BigCommerce documentation rather than an old screenshot. The category view in admin may not match the tree your merchandisers use, because the documented grains are order, product, and variant.
Practical rule: Use native reports for a quick product check. Move to an export or a reporting tool once category totals have to land on a schedule.
If you also track which category pages people search for, SemDash ecommerce keyword workflows are a useful companion to the sales view. Search demand and sales rank are different questions, and mixing them is how a slow category gets cut while it is still bringing qualified traffic.
Define Gross, Net and Units Before You Compare
The same word means different things across reports. Write the definition into the report title so nobody compares a gross number with a net one.
| Metric | How it is calculated | Watch for |
|---|---|---|
| Gross sales | Quantity x unit sale price, per line item | Measured before any discount or refund |
| Order discounts | Order-level discounts allocated to the category | Check how discounts were split across items |
| Net sales (your definition) | Gross sales minus discounts and refunds, excluding tax | Write the definition into the report title |
| Revenue (Orders Report) | Line-item sale price minus order-level discount, x quantity | Order-level tax is shown separately |
| Units sold | Sum of quantities | Units can rise while revenue falls |
| Average order value | Revenue divided by eligible orders | Averages hide high-ticket outliers |
| Refund rate | Refunded value divided by gross sales, same period | Refunds can relate to earlier orders |
| Profit | Not calculated by these reports | Requires verified cost data |
Net sales is a choice you make, not a button the platform presses for you. A common version is gross sales minus order discounts and refunds, with tax left out. If your finance lead wants tax inside the number, say so in the title. Two “net” columns with different contents will wreck a month-over-month comparison.
In the BigCommerce Orders Report, revenue is the sum of line-item sale price minus order-level discounts, multiplied by quantity. AOV is that revenue divided by eligible orders. Order-level tax is available, and you can open an order for product, customer, quantity, and discount detail. That revenue figure is not “money after refunds,” and it is not profit.
Why units and revenue disagree
A category can sell more units and still bring in less money when prices fall or order-level discounts deepen. Treat refund rate as refunded value divided by gross sales for the same category and period. Refunds booked this month often belong to orders placed earlier, so a weak refund rate in a launch week is not proof the category is clean.
These reports do not calculate profit. Category profit needs verified costs: product cost, fulfilment, and what you spent to acquire the order. Without those inputs, a high-revenue category can be the one you lose money on.
Put the definition in the report title. “September net sales, discounts and refunds out, tax out” beats a column labelled Revenue.
Teams stall on category reporting for the same reason BI rollouts stall on data modeling: the columns were never defined before the chart was built. If you want the wider set of native views before you export, start with BigCommerce analytics and decide which metric each screen is showing.
How to Build Category Totals Without Double Counting
A product can belong to more than one category. Drop its full revenue into every category it sits in, and the category view sums to more than the orders that produced it. One item tagged in two categories counts once in the order total and twice in the category report. Nothing flags the gap. The totals just come out wrong.
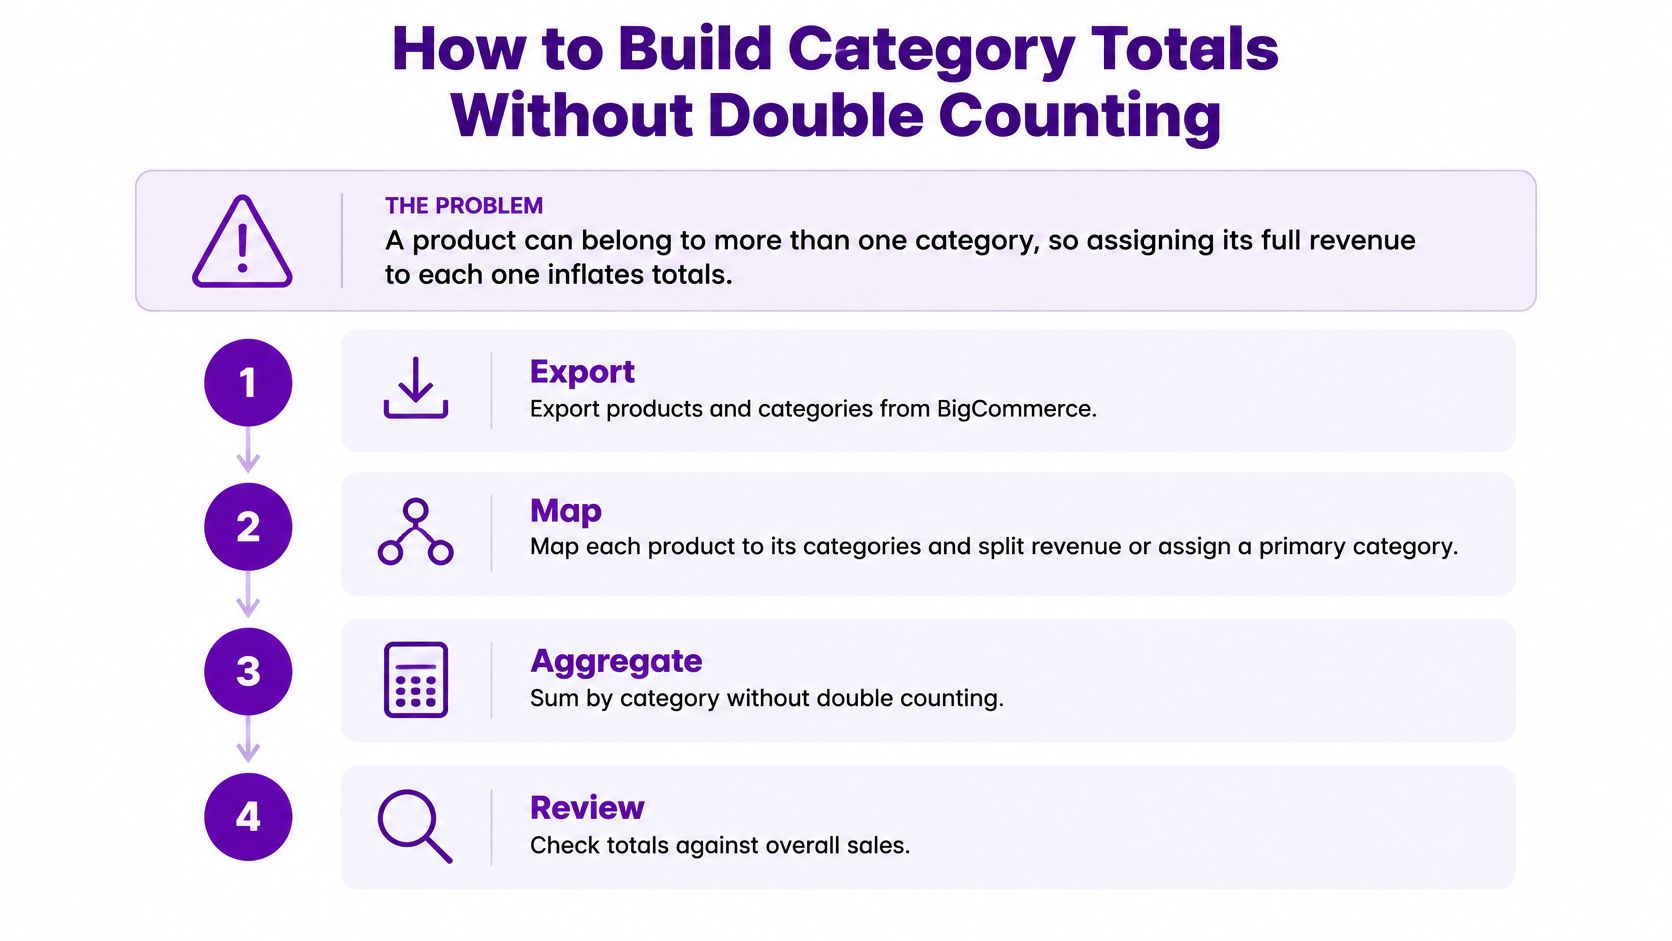
Work from line items, not whole orders. BigCommerce's API reference describes the Catalog API as the system for products and categories, and order resources as the transaction layer you join to it.
- Export the line items. Pull order ID, product or variant ID, quantity, and unit sale price for the period. Without line items you cannot split a basket that holds shoes and socks. The usual mistake is exporting one row per order and assigning the whole order to the first product's category.
- Snapshot the mapping. Join each product or variant to the categories it belonged to when the order was placed. Categories get renamed and products get moved. Applying today's tree to last year's orders rewrites history.
- Pick one attribution rule and write it down. Your options are a primary category only, a fractional split across categories, or a separate multi-category bucket that parks the overlap. I default to fractional splits when the numbers feed a finance reconciliation, because every category total stays additive. A primary-category rule is easier to explain but understates each secondary category. Never mix rules in the same file, and never sum full revenue into every assigned category. That is the mistake that inflates totals.
- Calculate line-item gross sales. Multiply quantity by unit price, then add the result under your rule. Do this at SKU or variant level before you roll up to the category name.
- Subtract discounts, refunds, and tax using the definitions you already wrote. Keep them as their own columns. Fold them into gross sales and the next reconciliation becomes impossible.
- Reconcile to the order total. Aim for a 100% match between attributed line-item revenue and your defined order-sales measure. Chase any gap for refunds, cancellations, tax treatment, currency conversion, or a category assignment that changed after the order.
The filter that drops products
If you pull products through the API instead of exporting from the control panel, confirm in the current BigCommerce endpoint documentation that the category filter returns every membership a product holds. A filter that matches only one membership per product will drop the rest, and the extract will look complete while categories are missing lines. Pull every membership first, then apply your attribution rule in the sheet. Use the filter to get a complete extract. Do the split yourself.
Category totals, after your rule, should add back to the order-level total with no unexplained gap. If they do not, fix the join before anyone presents the ranking.
Handling Refunds and Late Returns in Category Reports
Order status changes the totals. A category can look strong because the platform still counts money you have already given back.
| Order status | Included in order-total and revenue metrics | What to do in a category report |
|---|---|---|
| Refunded | Excluded | Track the refund value separately from sales |
| Partially Refunded | Full order total included | Subtract the refunded amount in your net sales definition |
| Other statuses | Check the status list in your store | Confirm each status before reconciling totals |
BigCommerce analytics reports state that orders with Refunded status are excluded from order-total and revenue metrics. Orders marked Partially Refunded contribute their full order total, including the refunded amount. Platform revenue is not the cash you kept. Separate fully refunded orders from partial ones instead of assuming the revenue column already did that work.
Late returns rewrite the week
A category can look healthy in the week after a promotion and weaker once the return window closes. Compare sales with refunds by order date and by refund date. A refund dated in January against a December order belongs in both views, for different reasons. One view shows demand. The other shows what you retained.
Match the wait to your policy. If customers have 30 days to return, do not lock a month's category results while that window is still open.
Say a shoe store, in a hypothetical month, records 500 units in the shoe category and a strong revenue figure on day seven. Later, 40 of those orders are partly refunded. The first report never moves. Your net column does, and it is lower than the ranking the buyer used to place the reorder.
Keep refund columns separate from sales columns in every category export. A single “net” cell hides whether the drop came from discounts, full refunds, or partials. For the status logic in more detail, see how to build a BigCommerce refund report before you fold refunds into a category scorecard.
Reading Category Sales Beyond the Revenue Ranking
A revenue ranking answers who billed the most. It does not answer who you should buy more of.
A high-ticket category can lead on revenue and still bring few repeat purchases. A low-priced consumable can trail on revenue and still build more customer value, because the same people come back. Put these next to revenue before you call a category a growth driver: units sold, AOV, the share of discounted orders, repeat purchase rate, and customer lifetime value.
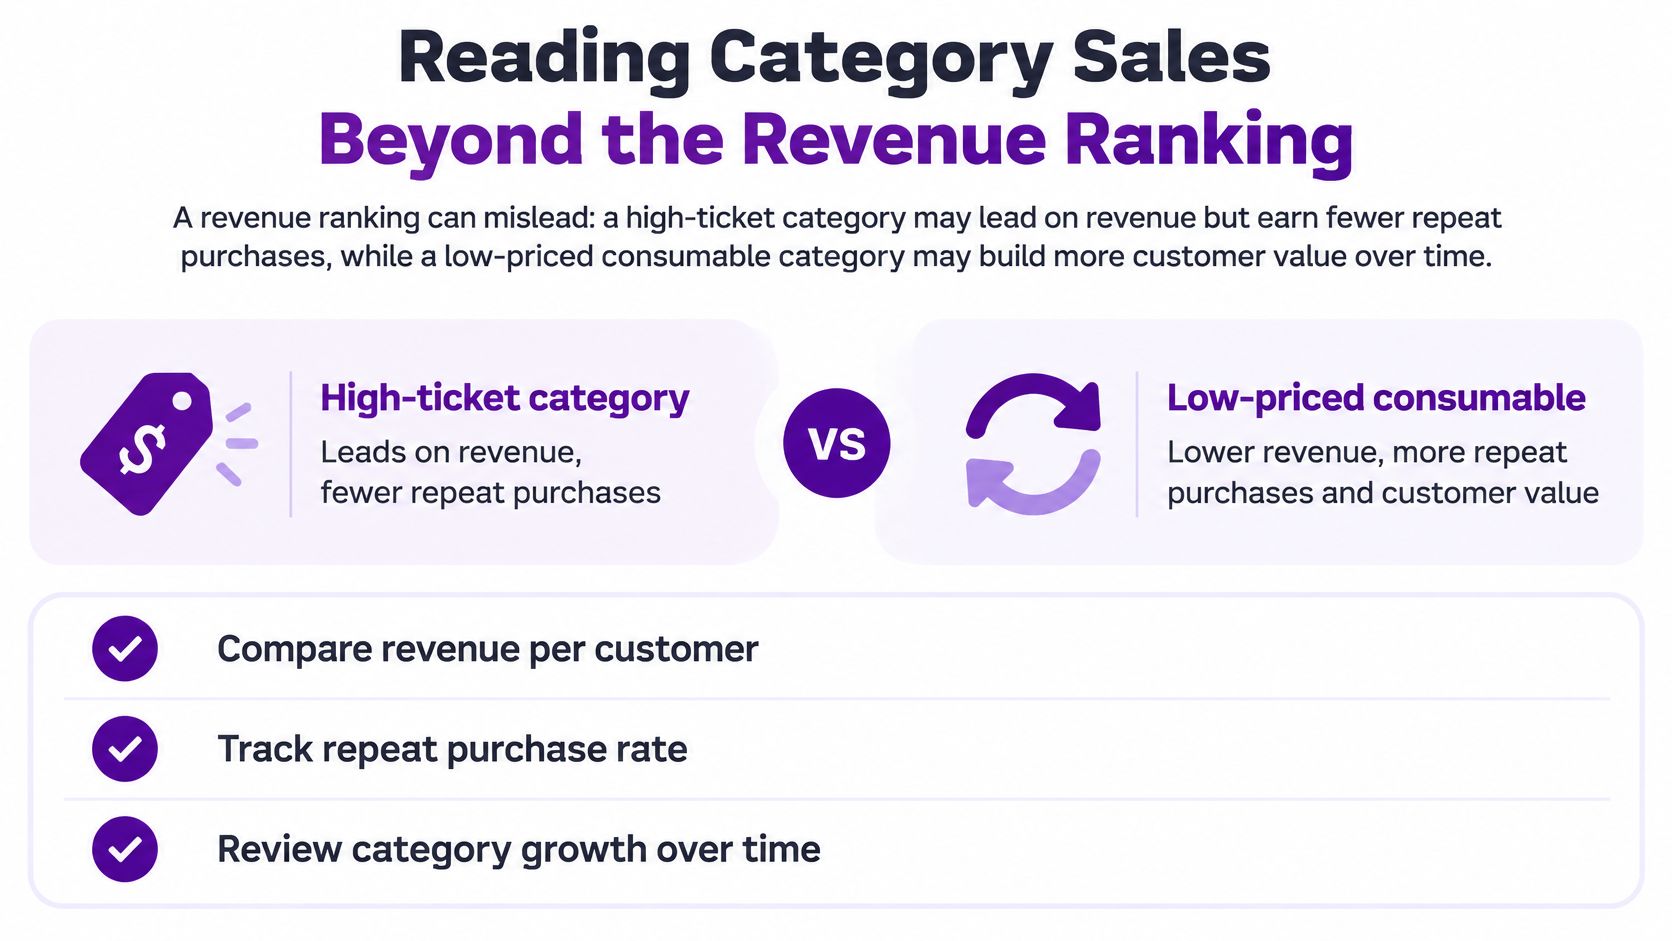
BigCommerce Ecommerce Insights defines repeat purchase rate as the percentage of customers who made a repeat purchase, updated monthly. Customer lifetime value is available at 30-, 90-, 180-, and 360-day checkpoints, also updated monthly, according to BigCommerce Ecommerce Insights. Compare categories on the same checkpoint. A 30-day value and a 360-day value are not the same claim.
Trade-up is not more demand
Adobe's 2025 holiday shopping recap is market context, not your store. It reported that the share of units sold from the most expensive products increased 20% during the holiday season. Higher category revenue can mean shoppers bought pricier items, not that more people bought. The same recap found groceries up 10.2% year over year and cosmetics up 9.3%, while electronics, apparel, and furniture generated more than half of holiday online spending. Use that only as a prompt to split your own baskets into units and price, not as a target for your catalog.
- Compare equal periods. September against August is fair. September against a holiday week is not.
- Split promotional days from ordinary days. A category that only wins on discount days is not the same as one that sells at full price.
- Split new and returning customers. A spike of first-time buyers can flatter a category that those buyers never revisit.
- Check units and AOV before you name a growth driver. You want to see whether growth is more buyers or pricier baskets.
A category with slower unit growth can still be the stronger one if repeat buyers stay and you did not have to discount it to get the order.
The same habit shows up outside the store admin. Teams that compare campaign reporting across clients already separate a big send from a send that brings people back. Do that with categories too.
Run Your First Category Report in Chartsy
Native reports are enough for a one-off product check. Repeating a category report by hand means rebuilding the mapping, the filters, and the reconciliation every month. A reporting tool is worth it only after that spreadsheet already matches.

- Connect the store. Follow the current BigCommerce setup steps. Our analytics track revenue and product performance at store, category, product, and SKU level.
- Ask in plain English. Try “Show monthly sales by category, including discounts and refunds.” You get a chart from that question instead of rebuilding the pivot.
- Check the chart against your definitions. Confirm Refunded and Partially Refunded orders follow the net sales rule you wrote down. If the chart treats a partial as a full kept sale, it is wrong for your report even if the picture looks tidy.
- Save it, then export. Charts can be exported to PDF or PNG when you need to share a month with a buyer or an agency. Save the report only after one past month matches your reconciled spreadsheet.
A reporting tool is a paid product, and no chart calculates product profit without verified cost data. The BigCommerce Pro plan includes a 14-day free trial, no credit card, and you can cancel anytime. Automate the monthly category report only after the figures match. Until they do, the spreadsheet is the source and the chart is a draft.
Chartsy helps you ask plain-English questions about BigCommerce sales by category, then save the chart once discounts, refunds, and your category rule agree with a reconciled month. It is built for store, category, product, and SKU views, not for guessing profit you have not costed. If you want to try that workflow on your own orders, start at Chartsy.

Written by
Chartsy TeamAnalytics team at Chartsy
The Chartsy Team writes guides, product updates, and resources to help SaaS and eCommerce founders make sense of their metrics, without SQL or spreadsheets.
Chartsy