What if your revenue total is right by BigCommerce rules, but still isn't the money you kept? That's the gap a good BigCommerce refund report has to close. If you only look at order status, you'll miss partial refunds, multiple refund events on one order, and the difference between a refund you quoted and a refund that settled.
I would build the report from refund records first, then compare it with your standard revenue views. That order matters. It lets you trace every dollar of refunded value to an order, an item, and a payment transaction.
Table of Contents
- Where BigCommerce Stores Keep Refund Data
- Refund Metrics and Formulas to Use
- How to Build a Refund Report from Refund Records
- Why Partial Refunds Can Inflate Standard Revenue Totals
- Separating One-Time Refunds from Recurring Order Changes
- Report Mismatches and What to Check
- Set Up Your First Refund Report
Where BigCommerce Stores Keep Refund Data
Refunds aren't a single field on an order that you can subtract from a total. They're separate records, each with its own ID, so a report built on order status alone misses detail you'll need when finance asks what happened.
Start with the order details page when you're checking one disputed sale. It shows refunds recorded against that order, including partial refunds. Use BigCommerce Analytics for store-wide order and revenue trends, but don't treat those totals as retained sales without checking how refunded orders were handled.
Why the refund record matters more than the order total
For line-item, tax, and reason detail, you need the refund records themselves. The BigCommerce refunds developer documentation describes refunds built around Orders V3 payment-action endpoints, available at order level and store-wide level, with refund IDs unique across the store.
A refund also runs in two steps. A refund quote calculates tax, total amount, and available payment methods, then a separate request executes it, and processing is asynchronous after validation. Payments must be settled when a gateway is used, and multiple refunds on one order should run sequentially because concurrent refunds aren't supported.
That distinction between master order data and transaction events is the same problem covered in understanding ERP master and transaction data, and it's why your report should keep order ID, refund ID, amount, tax, payment method, refunded items, and processing status together.
| Source | What it holds | Best for | Limitation |
|---|---|---|---|
| Order details page | Refunds recorded against one order, including partial refunds | Checking a single disputed order | Not suited to store-wide totals |
| BigCommerce Analytics reports | Order totals and revenue, with status-based views | Store-wide revenue and order trends | Refunded and partially refunded orders are treated differently |
| Orders V3 refund endpoints | Refund ID, refunded amount, tax, item ID, reason, transaction ID and creation time | Custom refund reports with line-item detail | Needs developer work and read access to orders or transactions |
| Order CSV export | Order-level fields included in your export template | Quick order checks in a spreadsheet | Confirm whether refund fields are included before building on it |
| Third-party reporting apps | Synced order and refund fields the app chooses to expose | Ready-made refund views without writing code | Check refund coverage and data history in the app's documentation |
Practical rule: Use the order page for one case, analytics for store trends, and refund records for anything you need to total, split, or reconcile.
Before you build on any source, open a sample export or API response and confirm the refund fields are there. If they aren't, record that as a limit rather than guessing.
Refund Metrics and Formulas to Use
Define the money first, then calculate rates. Most refund arguments aren't math problems. They're definition problems, where one person counts refunds by order date and another counts them by refund date.
Gross sales is order value before discounts and refunds. Net sales is what's left after you subtract both, and it isn't profit because it doesn't include product cost, shipping cost, or fees. Don't infer profit without verified cost data.
A worked example with round numbers
Say a hypothetical store has 400 orders, $10,000 in gross sales, $500 in discounts, and $800 in refunds across 12 refunded orders. If those refunds are 12 separate refund events, the table below shows what each metric tells you.
| Metric | Formula | Hypothetical example |
|---|---|---|
| Gross sales | Sum of order values before discounts and refunds | $10,000 |
| Discounts | Sum of discounts applied to those orders | $500 |
| Refunds | Sum of refunded amounts, counted by refund date | $800 |
| Net sales | Gross sales minus discounts minus refunds | $8,700 |
| Refund rate by order count | Refunded orders divided by total orders | 3% (12 of 400) |
| Refund rate by value | Refund total divided by gross sales | 8% ($800 of $10,000) |
| Average refund amount | Refund total divided by refund count | $66.67 ($800 divided by 12 refunds) |
| Refund-to-net-sales ratio | Refund total divided by net sales | 9.2% ($800 divided by $8,700) |
Notice the tension in those numbers. By count, refunds touch 3% of orders. By value, they take 8% of gross sales. Both are true, and they'd lead you to different conclusions if you reported only one.
That's why our page on refund rate definitions and calculations is worth aligning on before you share a dashboard. Agree on the formula first, then argue about the result.
Which metric answers which question
- Refund rate by order count: Shows how often orders run into trouble, which suits operations and support reviews.
- Refund rate by value: Shows how much sales value you gave back, which suits finance and merchandising.
- Refund rate by item quantity: Shows whether refunds cluster in units, useful when one SKU or variant keeps coming back.
- Refunded gross merchandise value: Shows the product value refunded before tax and shipping decisions blur the picture.
- Median days from order to refund: Shows how quickly problems surface, but you'll need original order dates kept alongside refund dates.
Keep tax and shipping on separate lines unless your business explicitly defines them as revenue. Mixing them into net sales makes period comparisons harder, especially when you're also tracking ecommerce revenue and ROAS and trying to keep channel numbers honest.
Report count and value together every time. A falling refund count with a rising average refund amount is not an improvement. It's a different problem.
How to Build a Refund Report from Refund Records
Treat each refund as a transaction-level event, not as a negative order value. The BigCommerce order refunds API reference returns fields including creation time, reason, total amount, tax, item ID, refunded amount, and transaction ID, which is enough to report by date, SKU or line item, tax, payment transaction, and reason.
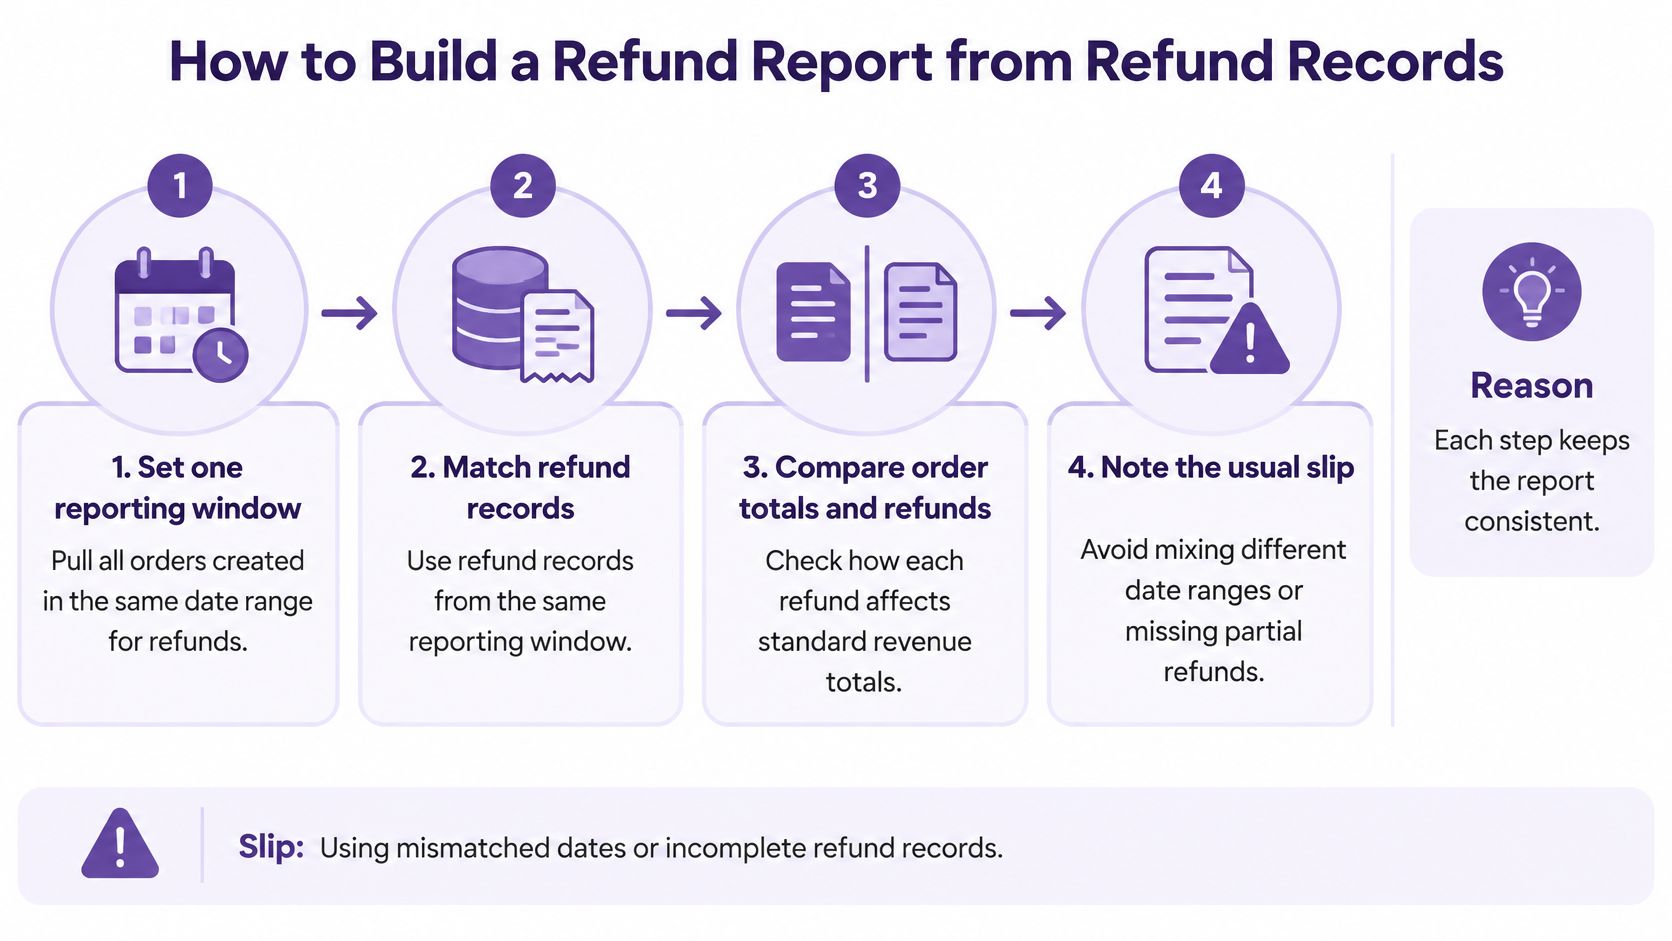
The build in seven steps
- Set one reporting window. Pull orders and refunds for the same date range and time zone. The usual slip is mixing a calendar month in your spreadsheet with store time in BigCommerce, which moves late-night refunds into the wrong period.
- Pull the refund records. Keep refund ID, order ID, refunded amount, tax, item ID, reason, transaction ID, and creation time for every event. Pulling only an order-level total is faster, but you'll lose the item and reason detail you need later.
- Join refunds to orders by order ID. Keep the refund ID as the event key so one row equals one refund. If you sum refunds per order too early, you'll hide multiple refunds on the same order and lose the audit trail.
- Keep both dates. Store the refund creation date and the original order date on every row. That lets you separate "orders from March that were later refunded" from "refunds processed in April," which are different questions with different owners.
- Classify each refund. Mark it full or partial, and split it by item where item IDs exist. A custom order-level amount with no item ID shouldn't be forced onto a SKU just to make a product table balance.
- Calculate separate measures. Build gross sales, discounts, refunds, and net sales as distinct columns, with tax and shipping on their own lines. The slip here is counting tax as revenue, which inflates net sales and breaks comparison with gateway reports.
- Reconcile before you publish. Compare totals with gateway settlements and flag duplicate transaction IDs, refunds above captured payment, missing item IDs, and refunds created after the period closed. If you're wiring this into a custom tool, the same discipline applies as in any payment integration for custom applications, where the payment record is the final check.
Our guide to building reports from the BigCommerce API covers the extraction side in more depth if you're handing this to a developer. Either way, keep the join logic documented so next month's report uses the same rules.
A refund report you can't trace back to individual refund IDs is a summary, not a report. Summaries are fine for a slide. They don't survive a finance review.
Finish with one arithmetic check for the period. Your net sales should equal gross sales minus discounts minus refunds. If it doesn't, don't adjust the difference away. Find the rows causing it, because they'll usually point to a duplicate join, a missing refund, or a date window problem.
A useful first KPI set from this build is refund rate by order count, refund rate by item quantity, refunded gross merchandise value, average refund amount, refund-to-net-sales ratio, and median days from order creation to refund creation. That covers frequency, value, product mix, and timing without turning the report into a wall of numbers nobody reads.
Why Partial Refunds Can Inflate Standard Revenue Totals
Most merchants assume the dashboard revenue total is the money they kept. With partial refunds, that assumption breaks.
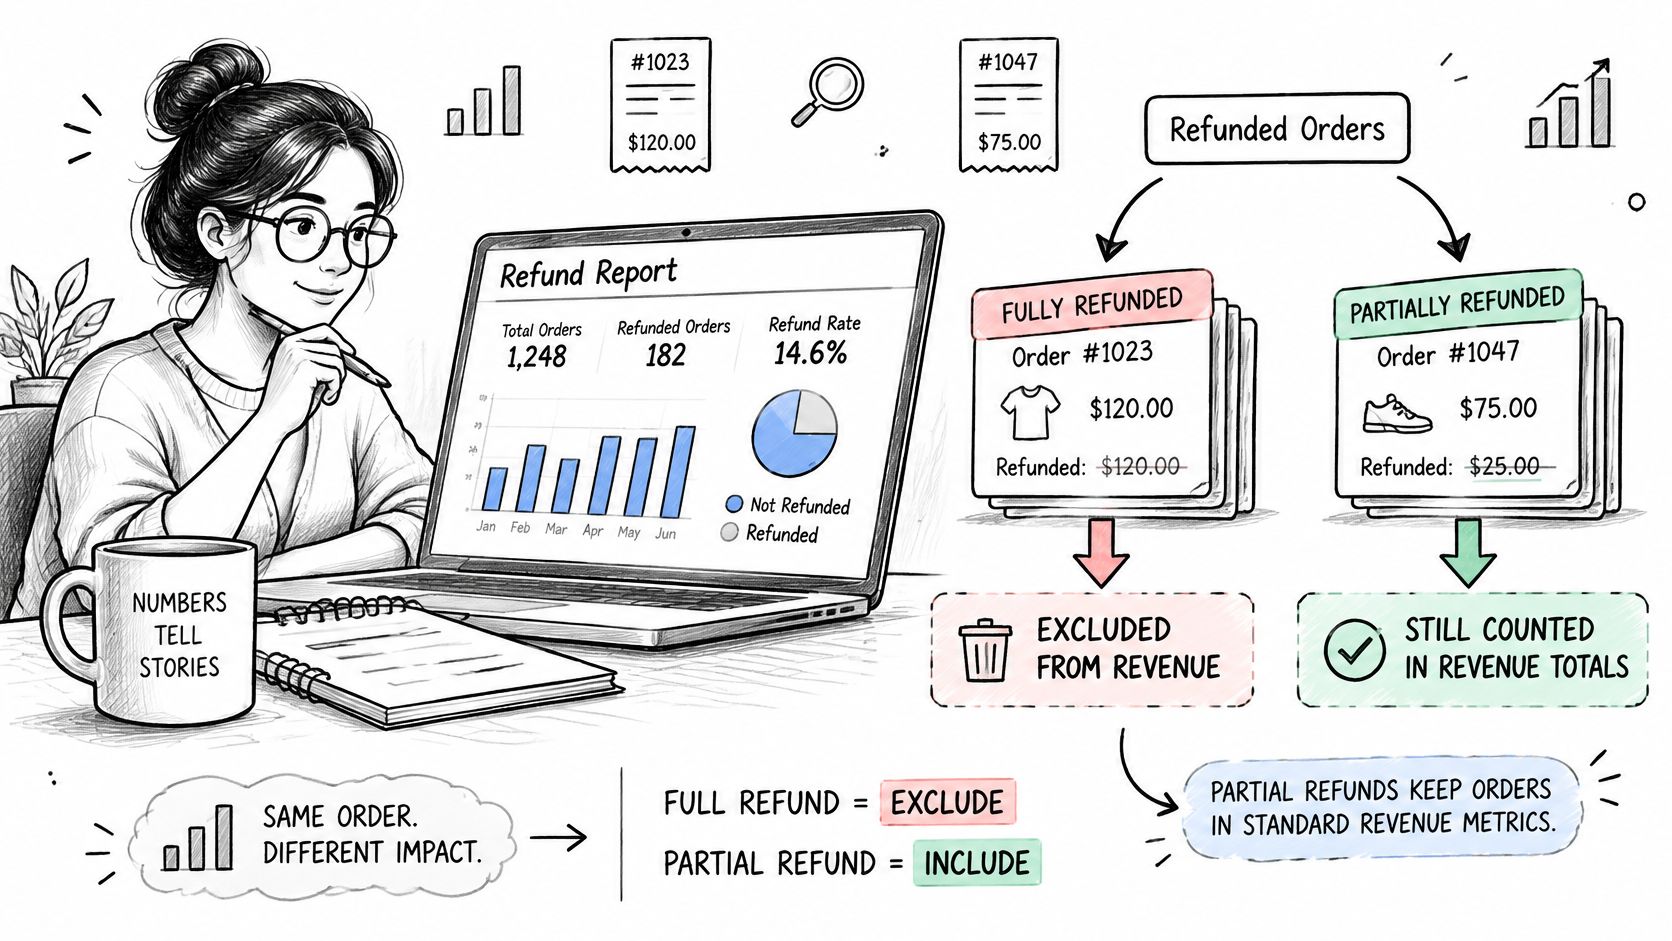
The BigCommerce Analytics reports guide documents a split that matters. Orders with the "Refunded" status are excluded from order-total and revenue metrics, while orders marked "Partially Refunded" retain their full order total in those metrics, including the amount refunded.
What that looks like on one order
Say a customer places a hypothetical $1,000 order and later gets a $200 partial refund for a damaged item. In the standard view, that order can still contribute $1,000, even though you retained $800. Fully refund the same order instead, and it contributes $0 once it reaches "Refunded" status.
Multiply that $200 gap across every partial refund in a month and the overstatement stops being a rounding issue. Stores with sizing exchanges, damaged-item credits, or price adjustments will feel it first because partial refunds are part of normal operations there.
How to check the size of your gap
Compare the analytics total for a period with net sales calculated from refund records. Then list partially refunded orders as their own line, with order total, total refunded, and retained value per order. If the gap equals the partial refund total, you've found it.
I would also track fully refunded order count and partially refunded order count separately from now on. They behave differently in standard totals, so they shouldn't share one bucket in yours. Our overview of how BigCommerce Analytics reports store performance is a useful companion when you're explaining that distinction to your team.
Don't try to fix quantity reporting from the order record either. Refunds don't update the legacy product-level quantity-refunded field, so quantity-level refund reporting should come from the refund endpoints or dedicated refund data. Building SKU refund rates on a field that doesn't move will understate product problems.
The fix is straightforward. Calculate retained value per order as order total minus its refund records, regardless of status. Then your revenue view reflects money kept, and order status goes back to being an operations label instead of a financial shortcut.
Separating One-Time Refunds from Recurring Order Changes
This split only matters if you sell recurring products on BigCommerce, usually through a subscription or repeat-order app. If you don't, skip it and keep your report simpler. Subscription SaaS metrics such as MRR don't apply here, because you're reporting physical or digital product orders, not software plans.
Your app has to mark renewal orders somehow, often with a source, tag, or similar identifier. Confirm exactly how it does that in the app's documentation before you build anything. Guessing the marker is how renewal refunds end up counted as first-order problems.
Three buckets that should never share a line
- One-time order refunds: Refunds on single purchases, where product, sizing, or shipping issues are usually the story.
- Renewal order refunds: Refunds on recurring orders the customer accepted at least once before, which points more often to timing, quantity, or skip-and-cancel friction.
- Recurring cancellations: Customers stopping future renewals, which reduce future orders but are not refunds and shouldn't be added to any refund total.
That last distinction is where reports go wrong. A cancellation is a decision about the future. A refund is money returned for an order that already happened. Add them together and you'll chase a refund problem that is a retention problem.
A hypothetical month with the lines kept apart
Say a store in March has 300 one-time orders with 9 refunds totaling $540, plus 180 renewal orders with 4 refunds totaling $260, and 14 cancelled renewals. The refund total for March is $800, made of two different stories. One-time refunds run at 3% of one-time orders, while renewal refunds run lower by count but deserve a separate look at skip and pause options.
The 14 cancellations sit on their own line. They tell you about future order volume, not about money given back in March. If cancellations rise while refunds stay flat, your fix is in renewal timing, reminders, or product fit over time, not in your refund process.
If a number didn't return money to a customer, it doesn't belong in the refund total, no matter how related it feels.
Report these as order counts and refund amounts, nothing more. They aren't profit, and they aren't verified revenue retention unless you've defined and measured that separately. Keeping the language plain protects the report when someone outside your team reads it and assumes a cancellation line means lost profit.
Once the split is stable, compare periods within each bucket only. A renewal refund rate rising against renewal orders is a real signal. The same rate diluted by a surge in one-time orders will hide it until renewals shrink enough to notice.
Report Mismatches and What to Check
Most mismatches come from timing or duplication, not from bad report logic. Check those two causes first before you rebuild anything. Rebuilding a correct report because a refund settled two days late wastes an afternoon.
Because refund processing is asynchronous after validation, a refund created near the period end may appear in your report before it appears in settlement. That one fact explains a large share of end-of-month arguments between operations and finance.
Match what you're seeing to the likely cause below, then run the check in the last column before you change a formula.
| Symptom | Likely cause | What to check |
|---|---|---|
| Refund total differs from gateway settlement | Refund created near period end or still processing | Compare refund creation date with settlement date |
| Refund total higher than expected | Same refund counted twice in a join | Deduplicate on refund ID and confirm IDs are unique |
| Refund exceeds captured payment | Payment not settled or order amount changed | Check payment status and settled amount before reporting |
| Refund rate spikes on one SKU | Partial refund on a multi-item order | Check item ID and refunded quantity |
Two checks worth running every month
- Duplication check: Count rows and distinct refund IDs side by side. If rows exceed distinct IDs, your join multiplied something, most often when an order has several line items.
- Boundary check: List refunds created in the last two days of the period and the first two days after it. Timing gaps almost always live at the edges, not in the middle.
A mismatch is only resolved when your net sales figure traces back to specific refund IDs that both sides can inspect. If the explanation is "timing, probably," it isn't resolved yet. Name the refunds, name the dates, and the argument ends.
Set Up Your First Refund Report
Run one concrete test this week. Pick one completed month, build the report from refund records, and compare your net sales with the standard analytics total for the same period. If partially refunded orders explain the gap, your method works and you've found money your dashboard was overstating.
Then decide how the report runs again next month. Rebuilding by hand is fine for a small order volume, but it breaks when the person who built the spreadsheet goes on leave. A saved, repeatable report with the same formulas each period is worth more than a perfect one-off.
We can help if manual work is the bottleneck. Our BigCommerce analytics tracks revenue and product performance at store, category, product, and SKU levels and exports to PDF or PNG, and it lets you ask questions in plain English and get charts instantly. A question like "Show sales and refunds by product for last month" or "Show monthly sales by category, including discounts and refunds" is the kind of recurring ask that shouldn't need a new spreadsheet each time.
Before you rely on any tool, including ours, confirm which refund details it includes and whether the export format suits your finance process. Our BigCommerce Pro plan has a 14-day free trial with no credit card required, and it can be cancelled anytime, so you can test it against your manual month before committing.
Keep your hand-built month as the reference either way. It's the yardstick every tool has to match.
End with the check that matters most. Net sales should equal gross sales minus discounts minus refunds, traced to refund IDs. If your first report passes that test, you have a BigCommerce refund report you can defend in any meeting.
Build your first BigCommerce refund report this month, then let Chartsy keep it current with plain-English questions, saved charts, and exports to PDF or PNG for your finance reviews. Start with "Show sales and refunds by product for last month," compare the result with your refund-record totals, and keep using the view that traces cleanly to refund IDs.

Written by
Chartsy TeamAnalytics team at Chartsy
The Chartsy Team writes guides, product updates, and resources to help SaaS and eCommerce founders make sense of their metrics, without SQL or spreadsheets.
Chartsy