
You're preparing next month's buying plan, and the SKU at the top of your sales report isn't the product your warehouse team says moves fastest. Finance has a different total again, because its file includes refunds. Before rebuilding another spreadsheet, decide whether you're measuring units, orders, merchandise revenue, or net sales.
BigCommerce sales by SKU starts with the native Merchandising Report. Use it for a quick product-performance check, then move to order exports or plain-English reporting when the question needs more detail than the standard view provides.
Table of Contents
- Which SKU Sales Measure Answers Your Question
- Find Sales by SKU in BigCommerce Analytics
- Export Orders to Rebuild SKU Totals
- Pick Variant SKUs and Reconcile Your Totals
- Separate One-Time Sales from Subscription Revenue
- Choose a Route and Set Up a Monthly SKU Review
Which SKU Sales Measure Answers Your Question
SKU sales measures and what each one tells you
| Measure | What it counts | Use it to answer |
|---|---|---|
| Units sold | Sum of units in eligible orders containing the SKU | Which products move the most stock |
| Orders with the SKU | Number of eligible orders containing the SKU | How widely a product is bought, regardless of quantity |
| Average selling price | Line revenue divided by units sold, after order-level discounts | Whether a SKU sells at full price or mostly on promotion |
| Merchandise revenue | Line-item sales after order-level discounts | Which products earned the most in the period |
| Refunds and returns | Value sent back on the same SKU | Whether a product needs a quality or expectation review |
| Net sales | Merchandise revenue minus refunds and returns | The fairest sales figure to compare across periods |
A stock-keeping unit, or SKU, identifies a sellable item in your operation. BigCommerce's Merchandising Report documentation describes a Product Option SKUs view with revenue, average price, quantity sold, and orders, ranked by revenue contribution.
The final rows in the table require additional care. Don't assume a native revenue column already represents your preferred refund-adjusted net-sales calculation. Establish what the report includes before relabeling it.
Follow the gross-to-net calculation
For a working merchandise calculation, gross sales means quantity multiplied by selling price before discounts and refunds. Subtract allocated discounts to calculate merchandise revenue, then subtract refunded merchandise value to calculate net sales. Keep taxes and shipping separate.
A return and its associated refund aren't two separate revenue deductions. Record the physical return for operations, but subtract its refunded value only once.
Hypothetical example: A candle set sells 120 units at $30, producing $3,600 before discounts. Allocate $600 of order-level discounts to those lines, and merchandise revenue becomes $3,000. If 10 units are returned for $300, net sales become $2,700.
Practical rule: Revenue tells you what sold. Profit requires verified costs.
A high-revenue SKU can still lose money after product costs, shipping, fulfillment, and fees. The native SKU measures described above aren't a profit calculation, so don't infer margin from the revenue ranking.
For broader reporting context, use this guide to BigCommerce analytics. Put net sales at the top of a monthly commercial review, with units alongside it; put units first when the meeting is specifically about replenishment.
Find Sales by SKU in BigCommerce Analytics
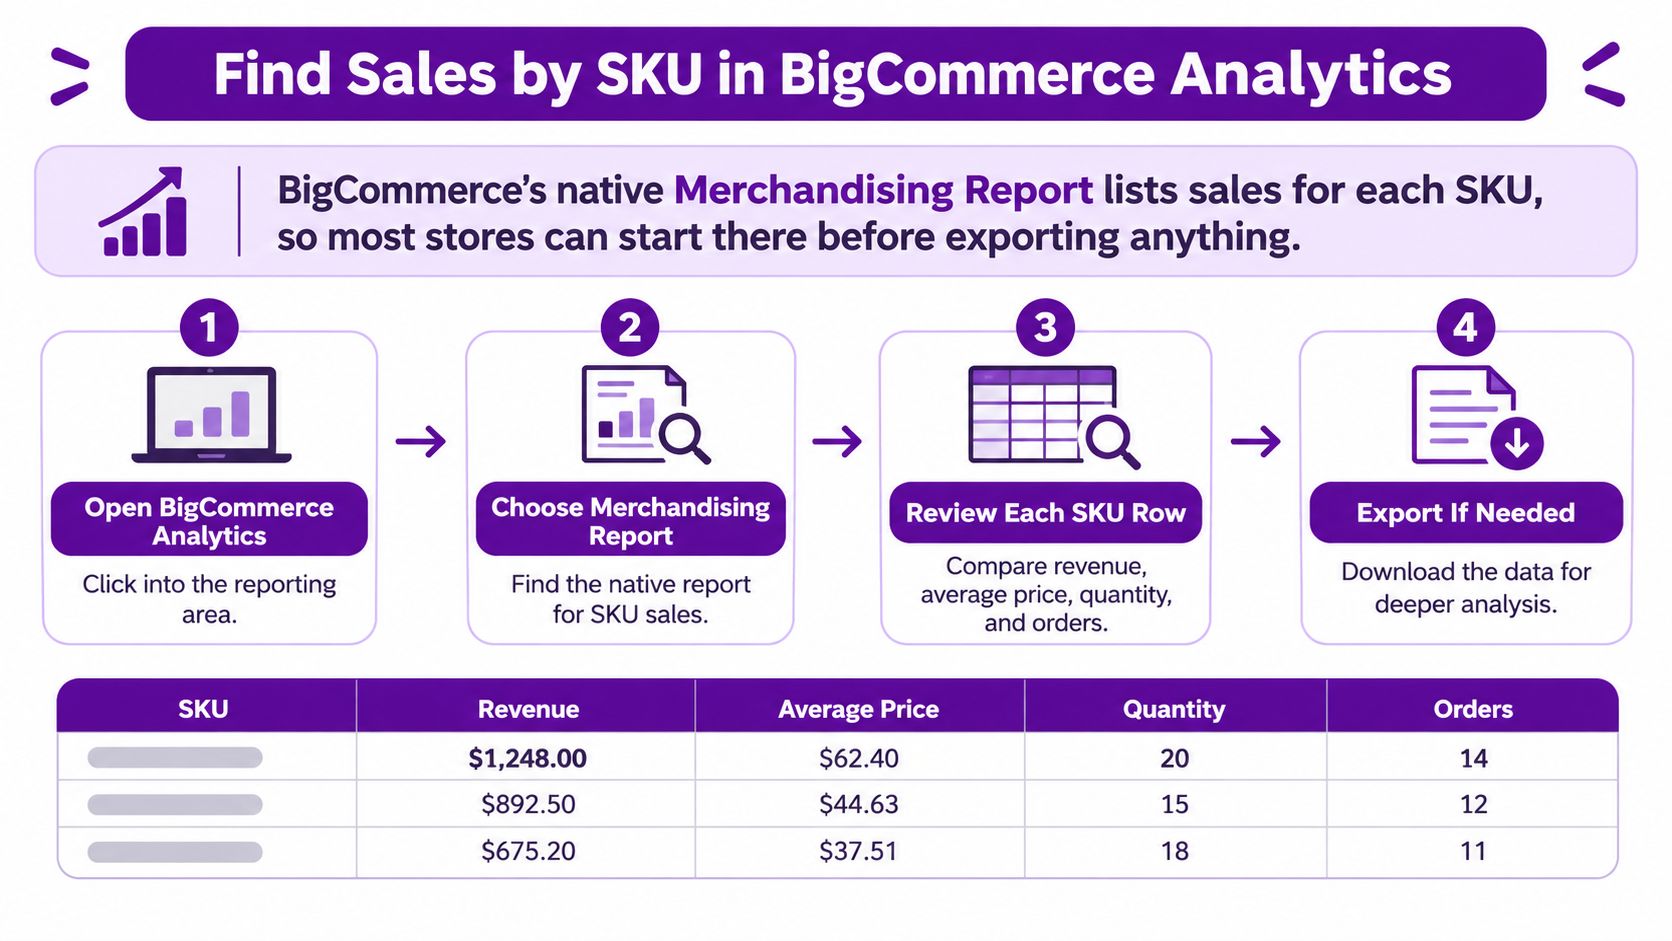
BigCommerce's native Merchandising Report lists sales for each SKU, so most stores can start there before exporting anything. The official Ecommerce Analytics documentation places merchandising analysis within the store's wider customer, marketing, and sales reporting tools.
Open the native SKU view
- Open Analytics in your BigCommerce control panel and enter Ecommerce Analytics.
- Open the Merchandising Report to review product performance.
- Set a custom date range, preferably a completed reporting period.
- Select Product Option SKUs to see the SKU-level revenue ranking.
- Read revenue, average price, quantity sold, and orders together on each row.
- Export the report as CSV when you need additional sorting or an external comparison.
Check the date selector before interpreting the winners. A reporting window that ends partway through the month can make a normally strong product look weak, especially if its promotion or replenishment arrived later.
Also distinguish the tools correctly: this is native BigCommerce Analytics, not a third-party reporting app. BigCommerce Insights is a separate offering, not the report you need to open for this workflow.
Compare like with like
For a question such as Compare September and August sales by SKU, run the report separately for each month and align rows by SKU, not by their ranking position. Those months aren't equal in length, so include units or revenue per day if the decision requires a pace comparison.
Keep SKUs that appear in only one period. A seasonal product, discontinued variant, or promotional bundle can disappear from a ranking without representing a reporting error.
Before using the result for purchasing, choose the leading SKU and inspect several familiar orders containing it. Check their quantities and eligibility against the report's rules; this is a spot check, not a substitute for full reconciliation.
When the conversation moves from sales performance to commercial returns, Reddog Consulting Group's a profitability playbook for omnichannel brands provides useful context for a separate cost-based review. Don't turn a sales ranking into a profitability decision without that extra work.
Export Orders to Rebuild SKU Totals
- Open Orders, then use Advanced Search in the control panel.
- Set the reporting period's date range.
- Select the order statuses your team counts as sales.
- Export the matching orders and open the file.
- Inspect the file's structure, making sure each analytical row represents a line item and that SKU and variant fields are usable.
- Sum quantity by SKU, and record the filters alongside the result.
BigCommerce's order import and export documentation describes exporting all orders or narrowing the selection through Advanced Search, including date range, shipping method, and order status. Exported product details can include product ID, quantity, SKU, name, weight, variant, and price, plus product-variation details.
Export fields and the SKU questions they answer
| Export field | Question it answers | Check before you use it |
|---|---|---|
| SKU | Which SKUs sold in the period? | Confirm whether the SKU is the parent or variant code |
| Variant | Which size or color sold most? | Blank values on simple products are normal |
| Quantity | How many units were sold? | Quantity is not revenue |
| Price | What did each unit sell for? | Confirm whether order-level discounts are already applied |
| Product ID | Which catalog product did the line come from? | Use it to link lines, not as a substitute for SKU grouping |
| Order status | Which orders count as sales? | Apply the same status rule in every export |
Use exports for transaction-level questions
An export earns its place when you need the transactions behind a summary, a shipping-method filter, or a file finance can inspect. It's also useful for investigating which SKUs appeared in canceled orders without mixing those lines into completed sales.
Don't assume the export is already a clean line-item table. Inspect how the chosen export template represents product details, and reshape them before building a pivot table if necessary.
Quantity and price aren't a finished revenue calculation. Verify how discounts are represented, allocate order-level discounts consistently, and obtain refund detail where needed. Otherwise, the spreadsheet can look precise while overstating sales.
For a structured review checklist, SellerAI prompts for reviewing order exports can help you formulate questions to investigate. Keep the actual calculations tied to the exported fields.
This guide to BigCommerce custom reports helps frame requirements beyond a standard export. Save the period, status policy, and other filters in the filename so someone else can reproduce the report next month.
Pick Variant SKUs and Reconcile Your Totals
The grouping decision changes the answer before you calculate anything. A parent product SKU can act as a family code, while the variant SKU identifies the specific sellable option, according to BigCommerce's order products documentation.
For size-and-color products, group by variant SKU when deciding what to replenish. Keep the SKU stored on the original order line rather than replacing it with today's catalog metadata.
Reconcile from transactions upward
- Write the reporting policy, including the date window and treatment of canceled and fully refunded orders.
- Extract the order line items for that scope.
- Remove duplicates using order ID plus line-item ID.
- Aggregate quantity and merchandise revenue by variant SKU.
- Compare with the same orders' totals, explicitly accounting for discounts, refunds, taxes, and shipping.
- Investigate differences, and list blank or custom SKUs separately.
BigCommerce's REST API overview is the starting point for developers building repeatable extraction. A production workflow needs pagination, rate-limit handling, and safe updates rather than an assumption that a single request contains every order.
SKU report symptoms, causes and fixes
| Symptom | Likely cause | Fix |
|---|---|---|
| Parent SKU total looks too high | Variants are grouped under one family SKU | Group by variant SKU for size and color products |
| Revenue does not match order totals | Refunds or order-level discounts were left out | Net out refunds and apply discounts before comparing |
| Units doubled after a re-run | The same order was read twice | Key rows on order ID plus line-item ID and replace the prior output |
| Old products show new names | Catalog edits changed current product data | Use the SKU stored on each order line |
| Large group of blank SKUs | Custom or unresolved line items | Flag and review them separately before publishing |
| Canceled orders are counted | No status filter was applied | Exclude them under your written reporting rule |
A reconciliation gap is a reason to inspect the calculation, not a reason to force the total to match.
Use these operating habits to keep the process repeatable:
- Keep filters stable. Change reporting rules deliberately, not accidentally.
- Archive each period. Preserve the source extract and the published output.
- Replace re-runs. Never append a replacement export to the previous file.
For return-heavy products, Arlo Inc.’s guidance to factor returns into fulfillment costs is useful for the operational follow-up. A refund adjustment fixes the sales calculation; it doesn't explain every cost of handling the returned item.
Separate One-Time Sales from Subscription Revenue
A SKU report measures recorded purchases, not a customer's commitment to buy again. A subscription renewal may generate another BigCommerce order, but that depends on how your subscription app creates and sends orders.
Recurring revenue is the amount expected to repeat from active subscriptions. A completed order is evidence of a purchase, not proof that the subscription remains active or that the customer will renew.
A subscription product needs another source
Hypothetical example: A coffee store sells 200 bags of a 250 g blend in March, with 180 bags from a monthly subscription SKU and 20 from one-off orders. The SKU report shows the units recorded in orders, but the subscription app's billing records establish which purchases were renewals and which subscriptions remain active.
The distinction matters when ordering stock. Historical shipments help explain demand already fulfilled, while active subscriptions and upcoming renewal dates provide a different planning input.
Use a separate classification workflow:
- Tag each SKU as one-time, subscription, or mixed.
- Pull active subscription records and renewal dates from the subscription app.
- Keep one-time sales and recurring-revenue figures in separate columns.
- Align the reporting windows and the date on which active subscriptions are assessed.
- Flag cancellations during the period rather than assuming every previous purchase will repeat.
Keep the labels honest
If the same SKU serves both subscription and one-off purchases, use an order-level subscription identifier where available. Don't classify every sale of that product as recurring merely because a subscription option exists.
If the necessary subscription fields aren't available, label the result subscription-associated sales, not expected renewal revenue. You can still review those orders without overstating what the report proves.
SKU sales alone don't establish monthly recurring revenue, and neither an order history nor an active-subscription list establishes product profit.
Choose a Route and Set Up a Monthly SKU Review
Native report, spreadsheet export and reporting tool compared
| Criteria | Native Merchandising Report | CSV export and spreadsheet | Chartsy plain-English reports |
|---|---|---|---|
| Setup effort | Built in; check permissions and data collection | Prepare filters and formulas, then maintain the template | Connect the store, then ask questions |
| Question flexibility | Fixed SKU view with a custom date range | Calculations you can build from available fields | Plain-English questions with custom columns, filters, and date ranges |
| Depth of data | SKU revenue, quantity, average price, and orders | Available order and line-item fields | Product, category, SKU, and variant analysis; refunds and discounts where supported by available data |
| Best fit | Quick checks of top SKUs | Audits and finance reconciliation | Repeated monthly questions without a dedicated analyst |
| Trade-off | Not a user-defined calculation workspace | Formula maintenance and manual error risk | Another tool to learn; confirm the report covers your required fields |
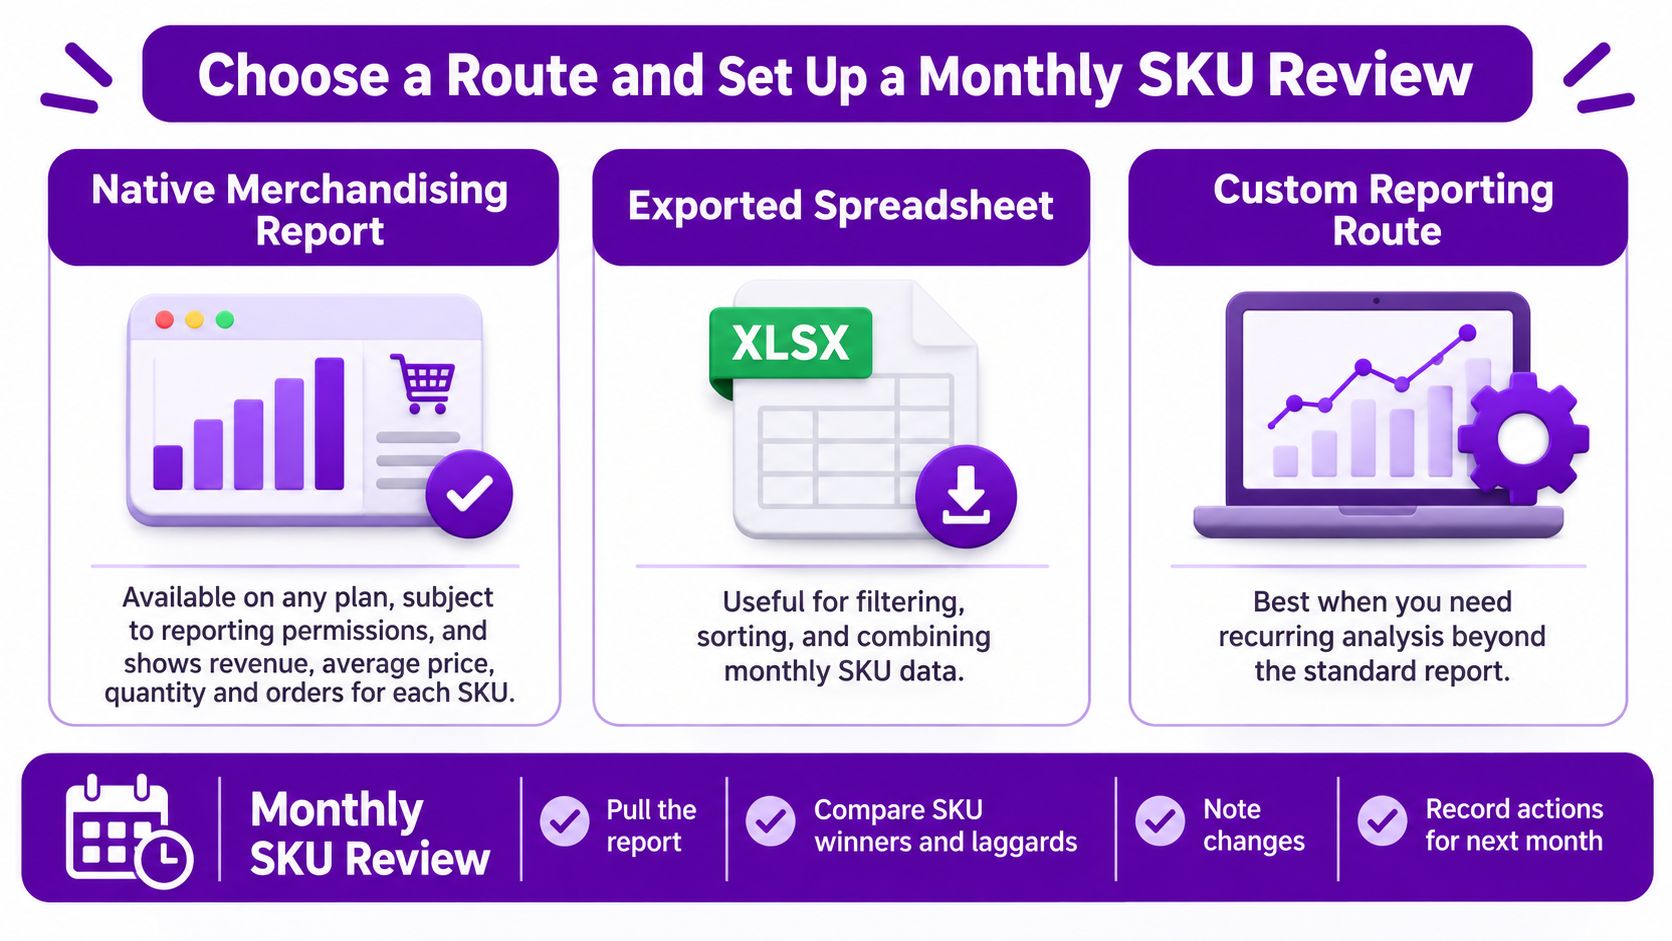
The native report is the sensible starting point when your question matches its columns. Ecommerce Analytics is available across BigCommerce plans, subject to reporting permissions and the relevant data-collection setting. You don't need to introduce another system merely to identify the leading SKU by revenue.
A spreadsheet is often the better audit tool. You can inspect individual lines, document exceptions, and show finance exactly how a calculation works. A reusable template reduces rebuilding, but someone still needs to validate each incoming export and protect formulas from accidental edits.
Use plain-English reporting for recurring questions
Chartsy's BigCommerce analytics lets merchants ask questions in plain English and turn store data into charts and reports. It supports revenue and product-performance analysis at store, category, product, and SKU levels, with PDF or PNG exports; for custom refund, discount, customer, or variant breakdowns, ensure the connected data contains the fields your calculation requires.
Start with a precise question rather than “show me sales.” Useful requests include:
- Period comparison: Compare September and August sales by SKU, including units and merchandise revenue.
- Variant performance: Which product variants generated the most net sales last month?
- Category review: Show monthly sales by category, including discounts and refunds.
- Customer behavior: Which customers made more than one purchase this year?
- Regional exceptions: Show sales and refunds by customer state.
Use the BigCommerce setup guide, not the separate SaaS guide. Our Get started guide has four steps, with separate setup paths for each product. Our BigCommerce Pro plan has a 14-day free trial, requires no credit card, and can be canceled anytime.
Build a review that ends with decisions
Begin each monthly review with the completed month and the same month last year. Keep a recent-period comparison too, but distinguish seasonal effects from changes following promotions, product launches, or availability problems.
Give the report a stable column structure: SKU, product or variant description, units, orders, merchandise revenue, available refund value, and calculated net sales. Add the comparison period beside those fields instead of distributing separate files that people must mentally combine.
Record the interpretation and action, not just the total:
- Units up, selling price down: Check promotion dependence before increasing the next buy.
- Refund value up: Review reasons and affected variants before repeating the campaign.
- A former leader missing: Check availability and SKU changes before assuming demand disappeared.
- Sales concentrated in repeat buyers: Investigate purchasing patterns separately from broad product demand.
Use these important BigCommerce KPIs to choose the wider store measures that belong beside the SKU review. Keep the meeting focused on decisions your team can make.
Start native, export for audits, and use a reporting tool when the same question keeps returning.
For your next review, choose a single unresolved question, write down its calculation and filters, and test whether your current route answers it reliably. A trustworthy report that changes a buying or merchandising decision is more useful than a dashboard full of unexplained totals.
Chartsy helps BigCommerce merchants explore sales and product performance through plain-English questions instead of rebuilding complex spreadsheets. Visit Chartsy and start with a specific report, such as monthly units and revenue by variant SKU, then validate it against a completed reporting period.

Written by
Chartsy TeamAnalytics team at Chartsy
The Chartsy Team writes guides, product updates, and resources to help SaaS and eCommerce founders make sense of their metrics, without SQL or spreadsheets.
Chartsy