
You've got a bestseller in one report, a different revenue total in another, and a spreadsheet that matches neither. That doesn't mean your store data is broken. It usually means each report is answering a different question, using different exclusions for discounts, order status, tax and shipping.
Getting BigCommerce sales by product right starts with choosing the report that fits the question, then applying the same definitions every month. I would rank products in the Merchandising Report, reconcile the total in the Orders Report, and use customer, channel and cart reports only for context. That order prevents most arguments about which number to trust.
Table of Contents
- Which BigCommerce Reports Show Product Sales
- Metric Definitions That Keep Product Revenue Honest
- Step by Step Product Sales Export
- Reading Product Rankings Across Periods and Categories
- Adding Customers, Channels and Abandoned Carts
- Why Product Totals Do Not Match Your Reports
- Build a Monthly Product Report in Chartsy
Which BigCommerce Reports Show Product Sales
| Report | Product detail it gives | Use it to answer | Watch out for |
|---|---|---|---|
| Merchandising Report | Revenue, order count and quantity sold at product and variation level, down to SKU | Which products and variants sell most | Product names can change, so aggregate by product ID, variant ID and SKU |
| Orders Report | Total revenue and average order value, using sale price less order discounts | Total sales and whether product totals reconcile | Gross catalog price, tax and shipping aren't product revenue |
| Carts Report | Converted carts value and abandoned carts ranked by product | Demand lost at checkout and effects of product-level discounts | Converted cart value excludes shipping, tax and order-level discounts |
| Customers Report | New versus returning share, total spend, last order date, average order value, price range | Which customer groups buy a product | Describes customers, not revenue per SKU; export to CSV |
| Visit Origin Report | Revenue, visits, orders, conversion rate and revenue per visit by referrer | Which channels bring buyers of a product | Orders with no assignable channel appear as Unattributed |
The Two Reports That Matter Most
Start with the Merchandising Report for rankings. It's the native view built for product and variation performance, so questions like "Which product variants generated the most net sales last month?" belong there first. Product level suits headline rankings, variation level suits size, colour or model splits.
Use the Orders Report as your control total. If your product export is higher than that report for the same period, you've probably included tax, shipping, catalogue price or ineligible orders. Our broader guide to how BigCommerce analytics reports fit together helps if you're mapping these views for the first time.
Context Reports
The Carts Report explains interest that didn't become an eligible order, while the Customers Report shows who bought, including each customer's order history in their profile. The Visit Origin Report adds traffic source, which is where deeper work to measure ROI from BigCommerce advertising becomes useful rather than guessing from revenue alone.
Practical rule: Rank in Merchandising, reconcile in Orders, explain with the other three.
Report names and availability can depend on your plan. Confirm the current labels in BigCommerce documentation before you build a monthly routine around them.
Metric Definitions That Keep Product Revenue Honest
Most mismatches begin with language. Gross sales start from product prices before deductions. Net sales reflect the amount left after the discounts and refunds you choose to count, while tax and shipping sit outside merchandise revenue. Profit is different again, because it needs costs. Don't call revenue profit, and don't infer margin from a sales ranking.
The BigCommerce Merchandising Report documentation supports revenue, order count and quantity sold at product and variation levels, including SKU-level performance, with net merchandising revenue calculated as (line-item sale price - order-level discount) x quantity. It also frames the Orders Report check, where total revenue is sale price less order discounts and AOV equals revenue divided by eligible orders.
Definitions to Use Every Time
| Metric | Calculation | What to count | Common mistake |
|---|---|---|---|
| Units sold | Sum of line-item quantities | Each line item, including each variant | Counting orders instead of quantities |
| Product orders | Count of eligible orders containing the product | Each order once, even with several SKUs | Counting line items, which double-counts multi-SKU orders |
| Net merchandising revenue | (Line-item sale price - order-level discount) x quantity | Eligible orders only | Using gross catalog price, tax or shipping |
| Average order value per product | Product revenue divided by eligible orders | Orders containing the product | Dividing by all store orders |
| Refund rate | Refunded orders divided by eligible orders | Refunds recorded in the period | Ignoring late refunds that change past totals |
| Profit or margin | Not in these reports | Needs verified cost data | Inferring profit from revenue |
SKU is the stock keeping unit that identifies a specific variant. AOV, or average order value, only makes sense when the denominator matches the numerator. If you're reporting revenue for one jacket, divide by orders containing that jacket, not every order in the store.
GMV, gross merchandise volume, is a platform-level comparison figure that includes shipping and taxes. It's useful for market context, not for deciding whether a single SKU earned its homepage slot. If net terms are still being used loosely in your team, align them with a clear definition of net sales for ecommerce reporting before anyone builds another sheet.
Eligible Orders Change Everything
Decide your eligible-order rule before calculating anything. Refunded, cancelled, declined, disputed, pending and awaiting-payment orders shouldn't be mixed into sales as if they completed normally. Keep refunds in a separate column, because a refund processed next month can change how last month should be interpreted.
Aggregate by stable IDs, not product name alone. A renamed product can appear as two products, and two variants can collapse into one row. Save a dated snapshot so later status changes and catalogue edits don't rewrite a comparison you've already shared.
Step by Step Product Sales Export
Use a closed period and the definitions above. Don't improvise the filters each month, because consistency matters more than squeezing in partial sales.
The four-stage flow below gives you the short version before the detailed checks.
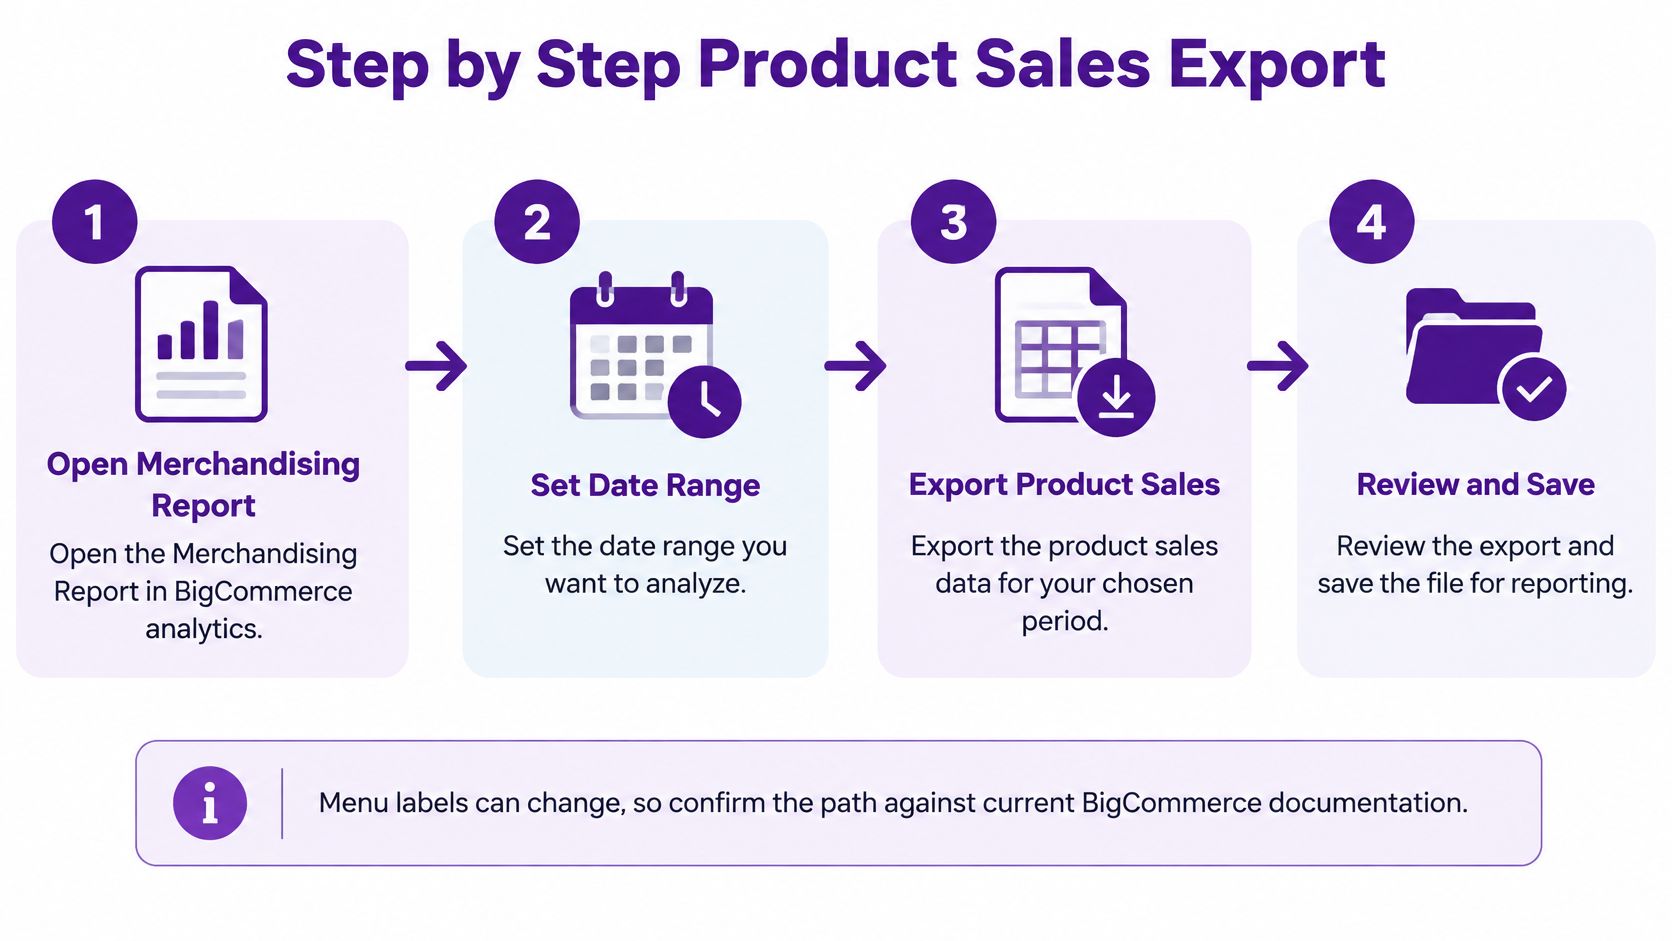
Export Steps
- Open the Merchandising Report: Find it in BigCommerce analytics. Menu labels can change, so confirm the path against current BigCommerce documentation before you document a routine for your team.
- Set a closed date range: Use the last full calendar month. Don't compare a partial current month with a full prior month, because the shorter period will look weak even if daily sales improved.
- Choose the reporting grain: Select product level for rankings. Select variation level when you need size, colour or other variant splits, and keep that choice consistent for comparisons.
- Confirm excluded statuses: Check that refunded, cancelled, declined, disputed, pending and awaiting-payment orders aren't included in sales totals. They may appear in order lists, but that doesn't make them completed sales.
- Sort and identify rows: Sort by revenue, then review units sold beside it. Identify every row by product ID, variant ID and SKU, not by product name alone.
- Export to CSV: Save the file with the date range in the file name, for example
product-sales-2025-09.csv. Keep the raw export unchanged and do your sorting in a copy. - Reconcile against Orders: Open the Orders Report for the same period and compare total revenue and order count with your export. A small gap can appear while discount and status rules are applied.
What a Clean Export Looks Like
You should finish with one row per product or variant, no duplicate IDs, and totals close to the Orders Report figure. Revenue, units and product orders should each be present, because revenue alone can't show whether growth came from more units or higher-priced variants.
If the gap is large, stop and fix the rules before you chart anything. A polished chart built on mixed definitions only spreads the error faster.
For stores repeating this monthly, a structured approach to creating custom BigCommerce reports with saved filters reduces the chance that someone changes a column or status filter without noticing. Keep the raw CSV anyway. It's your evidence when a later refund changes the story.
Reading Product Rankings Across Periods and Categories
Before calling a product a winner, compare equal periods by SKU and read daily averages beside monthly totals. August has 31 selling days against September's 30, so a product can lose the monthly ranking while improving per day.
Say two SKUs post these totals:
| SKU | August revenue | September revenue | August daily average | September daily average |
|---|---|---|---|---|
| A-114 | $6,200 | $6,150 | $200 | $205 |
| B-207 | $5,890 | $6,180 | $190 | $206 |
A-114 drops to second place on September revenue even though its daily rate improved. Calling it a loser on the monthly column alone misreads a shorter month.
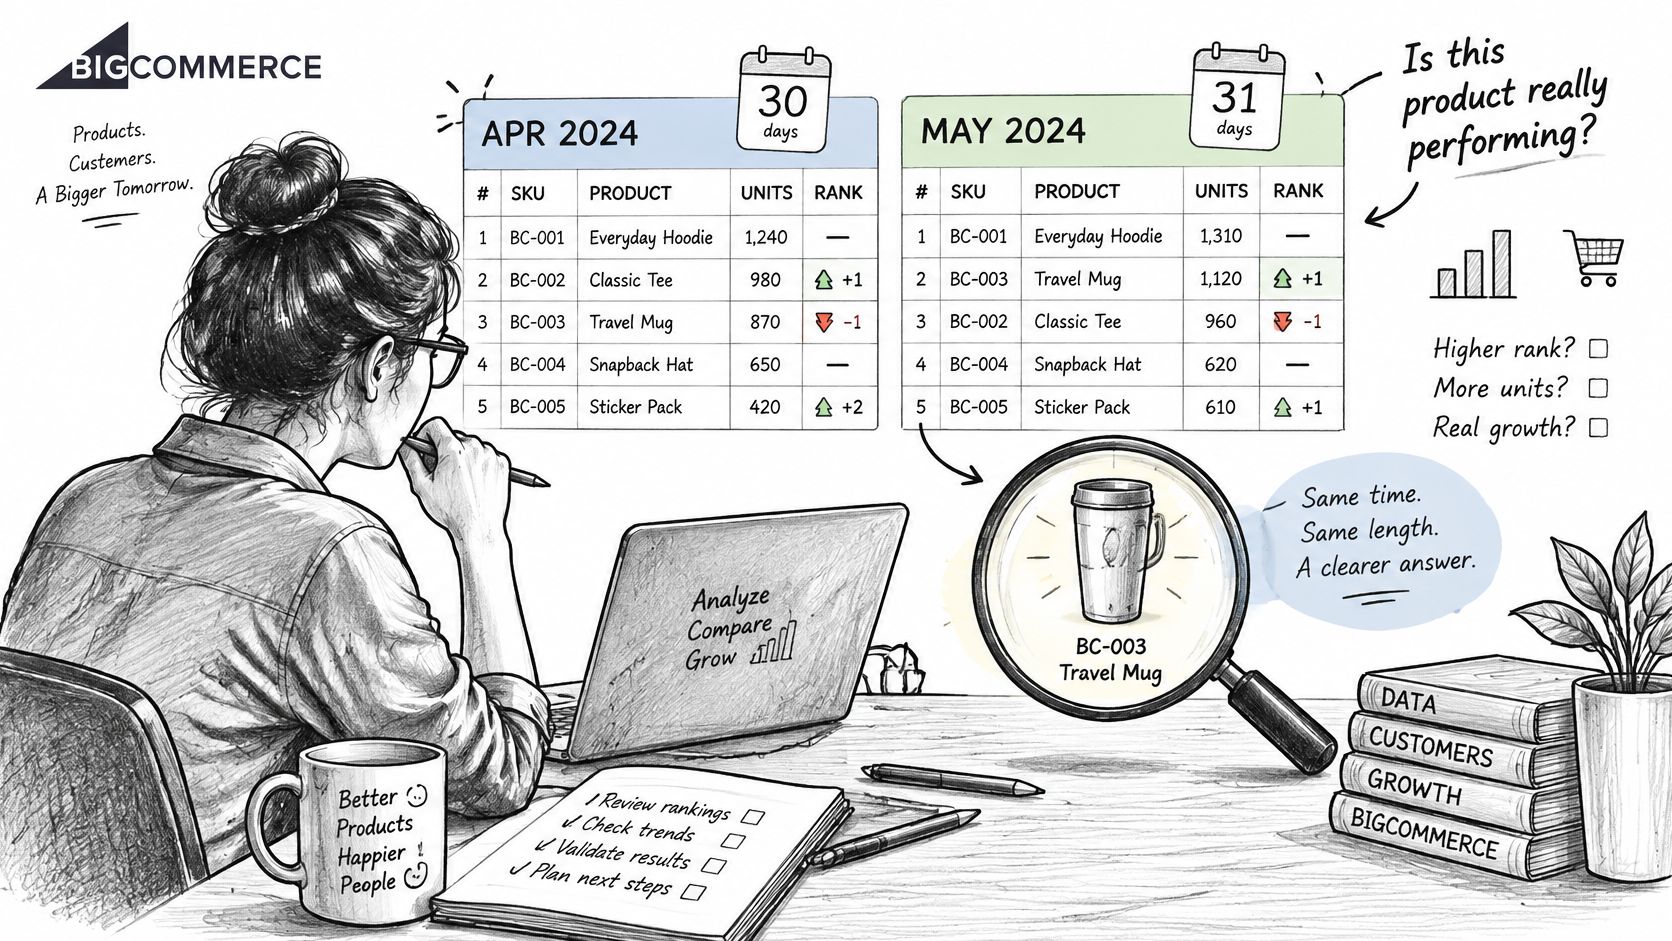
The ranking question matters too. A product that tops units can sit third on revenue, and a different period can flip the order again. Decide whether you are ranking by units, revenue or daily rate before you read the table.
Split Revenue Into Volume and Mix
Break every revenue change into volume and price or mix. Volume is units sold. Mix covers average selling price, discount depth and shifts toward pricier or cheaper variants.
Say a store sells 900 units of a bundle in August and 1,200 units in September at the same price. Revenue rises by a third on volume alone. If units stayed flat but revenue rose, the driver sits in price, variant mix or lighter discounts instead.
A bestseller is not automatically your strongest growth product. It may receive the most traffic, the deepest discounts or extra marketplace exposure. Compare its share of revenue with its share of units and the discount it took. Sellers on social marketplaces hit the same trap, and the guidance on tracking TikTok Shop profits with HiveHQ covers how to separate exposure from underlying product strength.
The short walkthrough below is worth watching before you present a period change to the wider team.
Seasonal Context, Not a Store Benchmark
Category timing can distort a single month. BigCommerce's Cyber Week 2024 announcement reported platform gross merchandise volume up 26% year over year for November 28 to December 2, 2024 versus November 23 to 27, 2023, with apparel and accessories up 52%, toys and games up 44% and sporting goods up 38%.
Those are platform GMV figures, not a target for your store. Use them only to remember that gift-oriented categories can surge seasonally, then fall back without anything being broken. Judge your products against your own prior periods, category role and promotional calendar.
Adding Customers, Channels and Abandoned Carts
Product revenue tells you what sold. It doesn't tell you who bought it, how they arrived, or how many nearly bought it. Add those lenses in that order.
The overview below maps the three checks to the reports you'll use.
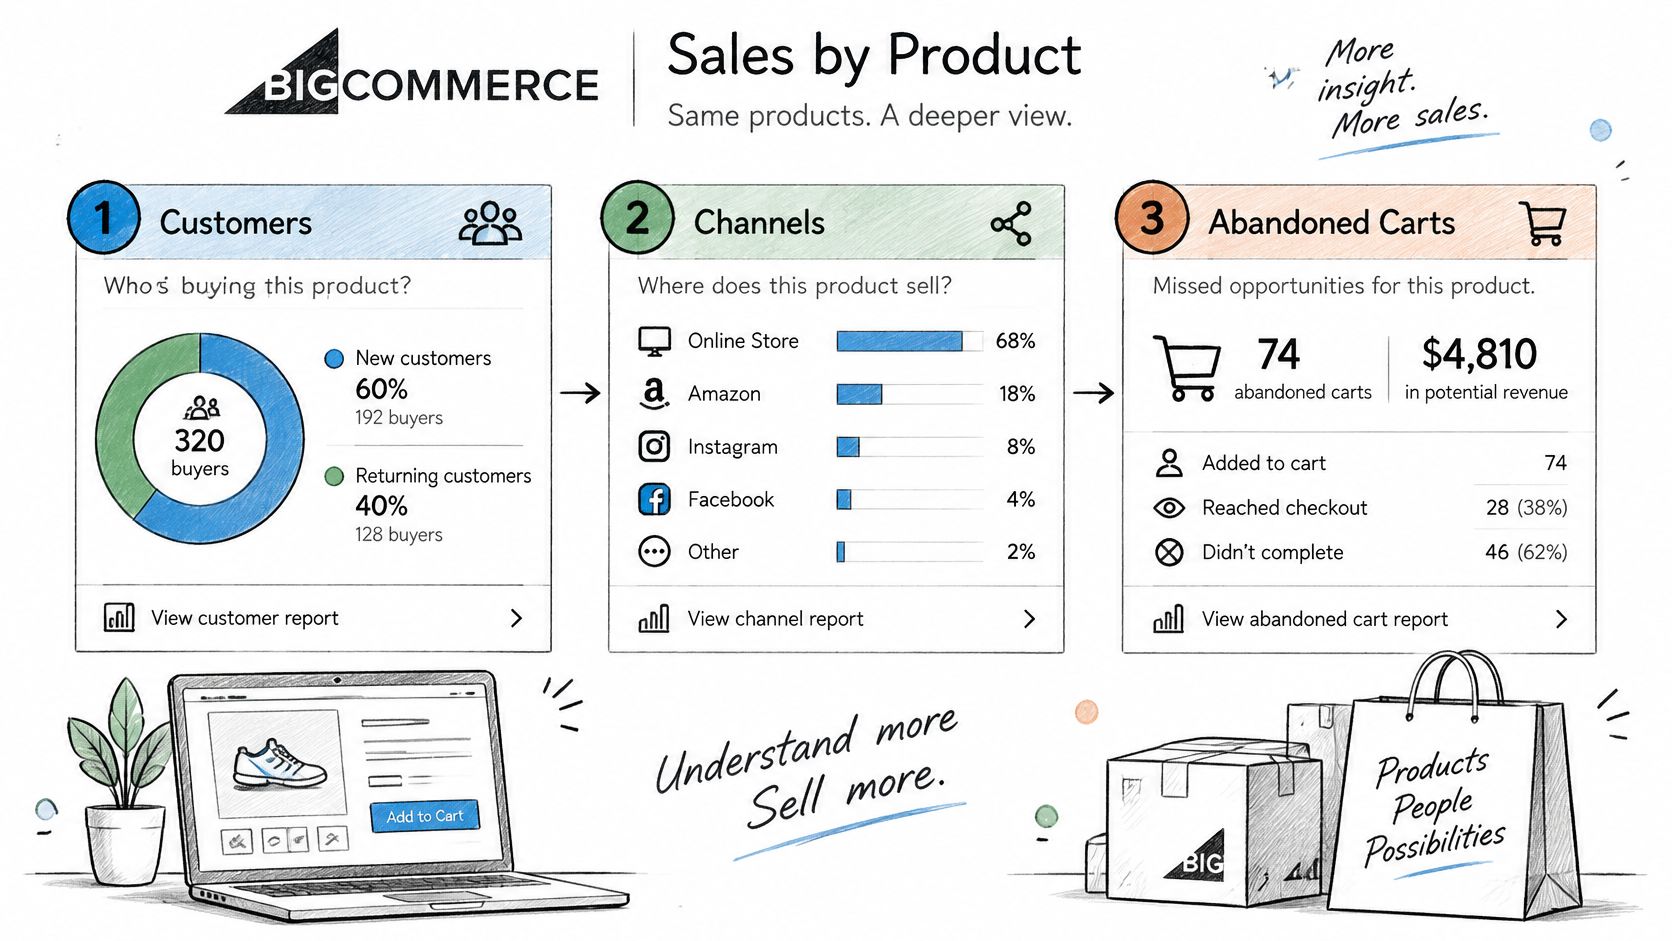
Customers First
Use the Customers Report to ask whether a product mainly reaches new buyers or repeat buyers. Check the new versus returning split, total spend, last order date and average order value, then open individual profiles when you need a customer's full purchase history.
Ask, "Which customers made more than one purchase this year?" and cross-check the products they repeat. A product bought mostly by first-time shoppers may be an acquisition product. A product with strong repeat buying needs different stock and retention decisions.
Channels by Order ID
Join product revenue to visit origin by order ID, not product name. The BigCommerce Marketing Report documentation describes the Visit Origin Report grouping revenue, visits, orders, conversion rate, average order value and revenue per visit by referrer or origin type. Calculate attributed revenue, orders, units and revenue per visit for each product, then compare them with direct totals to reveal the Unattributed share.
Don't treat channel revenue as complete. When storefront cookie tracking is enabled, reporting depends on shopper opt-in. Validate that channel-attributed revenue plus unattributed revenue explains the same eligible orders, and deduplicate multi-SKU orders by order ID.
Keep marketplace, manually created and API-created orders separate when you evaluate funnel conversion. They can appear in order reporting while following a different path from a normal storefront visit. A reporting tool can make these joins easier to request in plain English, but the underlying figures still come from BigCommerce.
Abandoned Carts Last
Rank abandoned carts by product and compare them with converted carts. A product abandoned often but converting well when shipping is clear may have a checkout or delivery-cost problem, not weak demand. Filter by identified, anonymous or all customers so you don't mix known shoppers with anonymous sessions.
One question per lens: Who buys it, where did they come from, and where do interested shoppers stop?
Why Product Totals Do Not Match Your Reports
Pull the same month from two BigCommerce reports and the top product rarely carries the same revenue figure in both. Each gap has a mechanical cause, and each question has one report you should trust for the answer.
| Symptom | Likely cause | Fix |
|---|---|---|
| Product total higher than Orders Report revenue | Gross catalog price, tax or shipping included | Use sale price less order discounts only |
| Same product appears twice in a ranking | Grouped by name; renamed product or variants | Aggregate by product ID, variant ID and SKU |
| Order count inflated | Multi-SKU orders counted per line item | Deduplicate by order ID |
| Converted cart value differs from revenue | Carts Report excludes shipping, tax and order-level discounts | Label the figure as cart value, not net sales |
| Past months change after a new export | Late refunds, status changes or catalog edits | Save a daily snapshot or immutable order-event table |
| Recurring revenue looks low in the funnel | Some order types may not appear in funnel reports | Compare with the Orders Report and flag non-storefront orders |
Cart Value Is Not Net Sales
The BigCommerce Carts Report documentation states that "Converted carts value" is calculated from product line-item revenue plus product-level discounts, while shipping, taxes and order-level discounts are excluded. It also ranks abandoned carts by product from most frequently abandoned to least frequently abandoned.
Label that figure as cart value in every dashboard and export. Cart value excludes tax and shipping, so it isn't a net sales figure and won't reconcile line by line to the Orders Report.
When Last Month Changes
Late refunds, status changes and catalogue edits can alter a past period after you've reported it. Keep a dated daily snapshot or immutable order-event table, and compare new exports only against the same snapshot date. That habit also helps managers use financial data for smarter decisions because they can explain what changed instead of debating whose export is correct.
Once you know which report answers which question, most mismatches stop looking like errors. Trust the Orders Report for revenue and order counts, the Carts Report for what shoppers intended to buy, and funnel reports for where sessions turn into orders. Flag orders that took a path outside the storefront rather than forcing every report to tell the same story.
Build a Monthly Product Report in Chartsy
Start with one report for the last full month. Show net merchandising revenue, units sold and product orders by SKU and variant, with refunds and discounts in their own columns. Use product ID, variant ID and SKU as the row keys, with product names only as labels.
Chartsy's BigCommerce analytics tracks revenue and product performance at store, category, product and SKU levels and exports to PDF or PNG. You can ask questions in plain English and get charts instantly, for example, "Which SKUs sold the most units last month, with refunds beside each one?" Then ask how that list changed against the month before.
Three Checks Before You Share It
- Reconcile the total: Compare it with the Orders Report for the same period and rules.
- Check the grouping: Confirm IDs drive the rows and duplicate names haven't split a product.
- Label order types: Keep one-time and recurring products separate where both exist.
Save the question as a recurring report so next month starts from the same columns and filters. The BigCommerce Pro plan has a 14-day free trial with no credit card required, and can be cancelled anytime. Run the report for the last full month today and compare its total with the Orders Report before you share any ranking.
Build your next BigCommerce sales by product report by SKU and variant, with discounts and refunds visible beside revenue and units, then reconcile it against your Orders Report total. Chartsy lets you ask that question in plain English and save the resulting chart for next month, so your team spends less time rebuilding spreadsheets and more time deciding which products deserve attention.

Written by
Chartsy TeamAnalytics team at Chartsy
The Chartsy Team writes guides, product updates, and resources to help SaaS and eCommerce founders make sense of their metrics, without SQL or spreadsheets.
Chartsy