
Are your customers coming back, or buying once and disappearing? Your monthly order total won't answer that. To identify BigCommerce repeat customers, you need to count distinct buyers, connect their orders, and decide how long they should reasonably take to purchase again.
The reporting gets awkward when customer summaries, order exports, and refund records tell different parts of the story. A returning-customer share can flag a change, but it won't necessarily tell you which first purchase led to another order or which customers have missed their usual reorder window.
Start with the customer views already available in your BigCommerce control panel. Use exports when you need to inspect the calculation, then consider saved reports and plain-English analysis when rebuilding spreadsheets becomes a recurring job.
That distinction matters when you're investing in paid social and search for ecommerce. Acquiring buyers and retaining them are different tasks. Before spending more to replace customers who don't return, find out who comes back, what they buy, and whether those purchases produce meaningful net sales.
Table of Contents
- 1. BigCommerce Analytics Customer Overview and New vs. Returning Customers
- 2. Order Export CSV for Custom Repeat Purchase Analysis
- 3. Customer Export for Order Count and Spend per Buyer
- 4. Chartsy Behavioral Segmentation With Loyalists, Promising, At-Risk, and Lost
- 5. Chartsy Top Buyers Report for Spend, Purchase Frequency, and Regional Comparison
- 6. Chartsy ChartsyAI for Plain-English Repeat Purchase Questions
- 7. Chartsy Product and Variant Reporting for Repeat Buyer Products
- Ways to Track and Grow BigCommerce Repeat Customers
- Put Your Repeat Customer Reporting on Autopilot
1. BigCommerce Analytics Customer Overview and New vs. Returning Customers
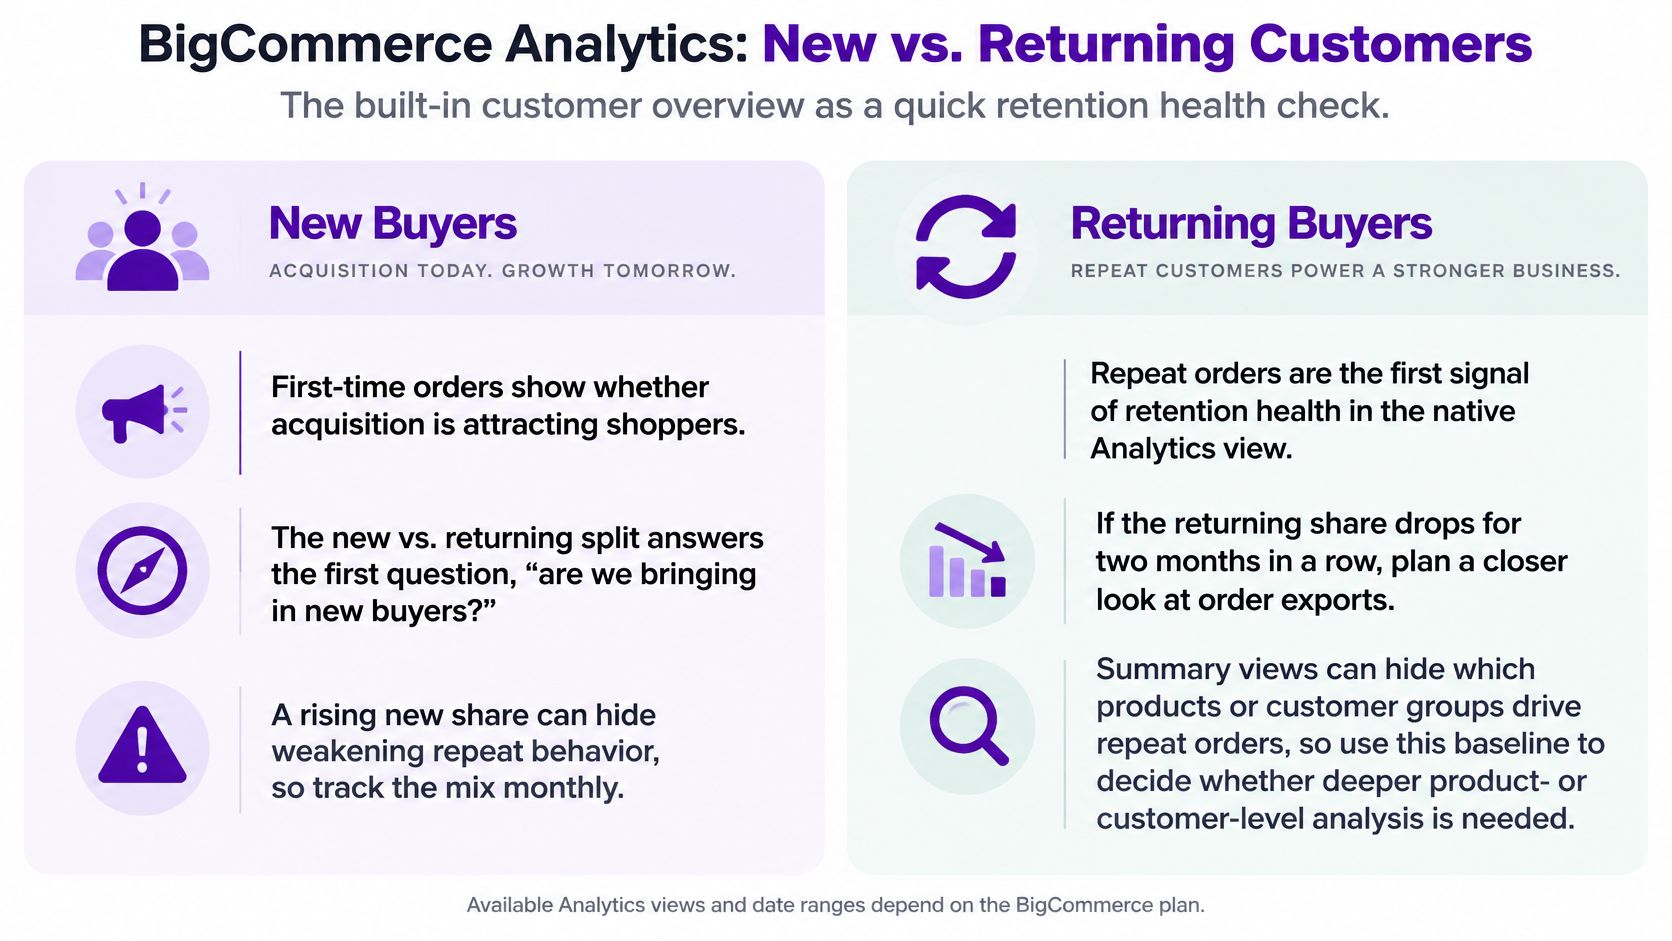
Start with the new-versus-returning customer split, not a new reporting app. It's the quickest way to check whether existing buyers are contributing to current sales.
In your BigCommerce control panel, open Analytics and inspect the available customer views. Confirm your plan's supported reports and date ranges before choosing a recurring reporting period. Keep native Analytics separate from BigCommerce Insights, whose customer analysis includes order histories, spending, purchase timing, and repeat-purchase measures, as described in the BigCommerce Ecommerce Insights documentation.
Read the split without overinterpreting it
Say a home goods store notices its returning-customer share falling across successive monthly reviews. That's a reason to investigate, not proof that retention has deteriorated. A successful acquisition campaign could increase new buyers while existing customers continue purchasing normally.
Record enough context to distinguish those situations:
- Customer counts: Compare the number of new and returning buyers, not just their percentage split.
- Comparable periods: Use consistent date boundaries and note promotions or seasonal changes.
- Next question: Decide whether you need individual order histories, product details, or customer-level spending.
A returning-customer share describes the buyers active during a period. A repeat-purchase rate needs a defined customer group and a stated opportunity to return. Don't use the labels interchangeably without checking the report's definition.
The BigCommerce customer reports guide provides a useful starting point for organizing those questions. Stay with native reporting when it answers them clearly; export only when you need more control.
2. Order Export CSV for Custom Repeat Purchase Analysis
An order export gives you control over the repeat-buyer calculation. It also makes you responsible for customer matching, order eligibility, and duplicate rows.
Export the relevant orders using your store's available export options, then inspect the file before building a pivot table. You need an order identifier, customer identifier, order date, status, and the financial fields relevant to your question. If the export contains product-line rows, count distinct orders, not spreadsheet rows.
Build the customer summary before the percentage
Group eligible orders by your chosen customer identifier. Calculate each buyer's order count, earliest purchase date, and latest purchase date, then sort their orders chronologically if you need time to second purchase.
Identity handling is the main trap. The BigCommerce Orders API documentation specifies that customer_id identifies registered customers, while 0 indicates guest checkout. Never group all guest orders into a single customer because they share that value.
Practical rule: Document your guest-matching method and excluded order statuses beside the calculation. Otherwise, next month's report may measure something different.
For a worked scenario, an operations manager could group orders by consistently normalized email addresses, remove cancelled and fully refunded purchases under a documented rule, and flag buyers with multiple eligible orders. Email matching is useful, but changed addresses and shared household emails can still distort the result.
Save the cleaned workbook as a template. CSV analysis is excellent for an audit or occasional investigation; repeating the cleanup every month is where it becomes expensive in staff time.
3. Customer Export for Order Count and Spend per Buyer
Customer exports answer who; order exports answer what happened. Combining them creates a customer-first report that's easier to use for retention work than a long transaction list.
Inspect your customer export's actual columns before planning the analysis. Don't assume it includes order counts, lifetime spending, or purchase dates. Where those fields aren't available, calculate them from eligible orders and join the results to customer records using customer IDs rather than names.
The BigCommerce Customers Report documentation is the appropriate reference for checking native customer reporting. Treat the native report and the export file as separate outputs, then verify what each contains in your store.
Keep period spending separate from lifetime spending
Say a marketing team wants a loyalty audience of customers who purchased repeatedly during the past year. A lifetime order count alone won't identify that audience correctly: a previously frequent buyer might not have ordered recently.
Build a customer summary with clearly named fields:
- Period order count: Eligible purchases within the selected reporting dates.
- Period net sales: Sales after your documented discount and refund adjustments.
- Latest purchase date: The most recent eligible purchase.
- Lifetime totals: Historical values, kept separate from period-specific results.
This distinction prevents a common mistake: calling someone an active loyal customer because they spent heavily long ago.
Customer-level files also need tighter handling than product summaries. Restrict names, emails, and addresses when sharing reports with agencies or contractors, and provide only the fields needed for the job.
This workflow works well for a carefully reviewed campaign audience. It's less suitable when your team needs continuously refreshed customer groups without repeatedly joining files.
4. Chartsy Behavioral Segmentation With Loyalists, Promising, At-Risk, and Lost
A customer with frequent past purchases and a long recent silence needs different treatment from someone who just placed their first order. Behavioral segmentation makes that distinction easier to act on.
Chartsy groups customers into Loyalists, Promising, At-Risk, and Lost, refreshed monthly. Its segmentation uses purchase behavior to help teams move beyond a store-wide returning-customer total. The BigCommerce customer segmentation guide explains how to organize that customer-level view.

Match the action to the purchase cycle
In a hypothetical skincare store, the At-Risk group grows after a seasonal promotion ends. Before sending a discount, inspect the customers' last purchased products, normal reorder timing, and previous discount use. Some may need a replenishment reminder; others may have bought a gift and have no immediate reason to return.
To segment customers by purchase behavior usefully, retain the underlying recency, order count, and spending fields. A segment label should help prioritize investigation, not replace it.
A customer isn't overdue simply because a calendar month ended. Compare their silence with the likely buying cycle of what they purchased.
Keep monthly snapshots of segment sizes and inspect movement between groups. Pair those changes with product data before deciding whether to send a welcome sequence, reorder reminder, or win-back offer.
The trade-off is speed versus detail. Monthly segments give a practical review rhythm, but they aren't a substitute for checking individual timing when replenishment cycles are short or purchases are highly seasonal. Don't send the same incentive to every group.
5. Chartsy Top Buyers Report for Spend, Purchase Frequency, and Regional Comparison
Your biggest spender isn't necessarily your most loyal customer. A large one-time purchase and a pattern of smaller repeat orders represent different customer relationships.
Chartsy's top buyers reporting ranks customers by spending and purchase frequency, with regional comparisons. Use both measures together, then inspect the purchase dates behind the ranking. A customer's position means little if the team can't explain the reporting window or what spending includes.
Rank customers on a consistent revenue basis
Gross sales describe sales before the deductions in your reporting definition. Net sales should reflect discounts and refunds consistently, with taxes and shipping shown separately or explicitly included. Neither figure is profit, which requires reliable cost information.
The BigCommerce refund documentation describes separate refund resources covering products, shipping, handling, gift wrapping, and custom order-level refunds. That's why original order totals alone aren't enough to rank realized customer value.
For a hypothetical outdoor gear retailer, frequent buyers appear concentrated in particular states. Before testing a regional reorder reminder, compare the broader customer base in those locations, not just the highest-spending names.
- Check concentration: Determine whether the pattern reflects many repeat buyers or a few unusually large orders.
- Control the comparison: Use the same dates, currency treatment, and refund rules across regions.
- Inspect products: Confirm whether regional differences come from different category mixes.
Save the report to a dashboard if the team reviews it regularly. The ranking is useful for prioritization, but a regional pattern alone doesn't explain why customers return or prove that a regional campaign will work.
6. Chartsy ChartsyAI for Plain-English Repeat Purchase Questions
Start with a question your team needs answered: Which customers made more than one purchase this year? That's more useful than asking an analysis tool to explain customer loyalty without defining the task.
ChartsyAI accepts plain-English questions and produces charts, explanations, and suggested follow-up questions. Reports can be saved to dashboards, reducing the need to rebuild the same analysis in a spreadsheet.
Specify the population, dates, and calculation
A useful prompt describes the customer group, reporting period, metric, columns, and exclusions. Ask for customer IDs and order counts when you need an actionable audience, rather than only a chart of totals.
For example:
Report request: Show customers with multiple eligible purchases this year, including customer ID, order count, latest order date, discounts, refunds, and net sales. Explain how guest orders and fully refunded orders are handled.
The distinction between different retention measures matters. The Retention Edge benchmark compilation distinguishes time-window repeat purchasing from annual buyer retention. Someone buying again after their first order is not the same measurement as a previous-year buyer returning this year.
Say a merchandising manager asks to compare repeat buyers by category across recent quarters. Before using the answer, confirm whether customers can appear in multiple categories and whether categories refer to their first purchase or any purchase.
AI removes formula work, not the need for definitions. Check a sample of customer records against order histories, verify the exclusions, and only then save the report for recurring use. If the answer is ambiguous, narrow the question instead of treating a polished chart as proof.
7. Chartsy Product and Variant Reporting for Repeat Buyer Products
A store-wide repeat rate can hide a useful merchandising pattern. Customers may buy a starter product once, then repeatedly return for a refill, accessory, or particular variant.
Chartsy's product analytics compare categories, products, SKUs, and individual variants across periods. A SKU is the stock-keeping identifier used to distinguish an item; a variant is a specific option, such as size or color. Keep those distinctions intact when investigating repeat purchases.

Separate popular products from products associated with repeat buying
Use the BigCommerce product variant reporting guide to structure comparisons below the category level. Ask which variants repeat customers buy, then separately investigate whether first-time buyers of those variants subsequently return. Those questions don't produce the same answer.
For a hypothetical clothing store, a particular color variant appears frequently in returning-customer orders. Check its availability, promotion history, and overall sales before featuring it in a reorder email. It may be the most widely stocked option.
Compare first-order cohorts, meaning groups of customers organized by when they first purchased, using equal observation windows. Otherwise, customers acquired earlier have more time to return.
- First purchase: Identify the item that introduced the customer to the store.
- Next purchase: Check whether they reordered it or moved to another product.
- Commercial value: Compare discounts, refunds, and net sales, not order counts alone.
Refund timing also affects comparisons. The BigCommerce refund creation documentation explains that refund processing is asynchronous, so a report refreshed before completion may show incomplete deductions.
Product patterns suggest what to test. They don't establish that a product caused loyalty.
Ways to Track and Grow BigCommerce Repeat Customers
| Item | Where It Runs | Effort Required | Best For |
|---|---|---|---|
| BigCommerce Analytics: Customer Overview and New vs. Returning Customers | BigCommerce control panel | Low; built in | Quick new-versus-returning customer checks |
| Order Export (CSV) for Custom Repeat Purchase Analysis | BigCommerce exports and a spreadsheet | High; manual setup and calculations | Flexible, one-off repeat purchase analysis |
| Customer Export for Order Count and Spend per Buyer | BigCommerce exports and a spreadsheet | Moderate; merge customer and order data | Customer lists and spend or order-count analysis |
| Chartsy Behavioral Segmentation: Loyalists, Promising, At-Risk, and Lost | Chartsy, connected to BigCommerce | Low; segments refresh monthly | Planning targeted retention and reactivation |
| Chartsy Top Buyers Report: Spend, Purchase Frequency, and Regional Comparison | Chartsy reports and dashboards | Low; save and review the report | Identifying valuable repeat buyers and regional patterns |
| Chartsy ChartsyAI: Asking Plain-English Repeat Purchase Questions | ChartsyAI | Low; ask questions in plain English | Quick exploration of repeat purchase data |
| Chartsy Product and Variant Reporting for Repeat Buyer Products | Chartsy product analytics and dashboards | Moderate; choose filters and comparisons | Finding products and variants linked to repeat purchases |
Put Your Repeat Customer Reporting on Autopilot
Start with the reporting already included in your store. Check the new-versus-returning customer split this week, then run an order export to identify buyers with multiple eligible purchases. Write down the date range, customer identifier, guest-order handling, and refund rules before sharing the result.
That first report should be small enough to validate. Choose a few customer records and compare the summary with their underlying orders. If the numbers don't reconcile, fix the definition or matching method before creating an audience or scheduling a campaign.
Automate the repeatable work, not the assumptions
Once the calculation is reliable, decide whether rebuilding it manually still makes sense. A spreadsheet is a reasonable choice for an occasional investigation. A saved dashboard becomes more useful when operations, marketing, and merchandising need the same answer regularly.
Keep the recurring review focused:
- Customer movement: Which buyers returned, slowed down, or stopped purchasing?
- Product relationships: What did repeat customers buy first, and what did they buy next?
- Revenue quality: Did repeat orders generate net sales after discounts and refunds?
- Next action: Which customer group deserves a specific reminder or merchandising test?
Chartsy connects to a BigCommerce store in minutes and provides 30+ KPIs, behavioral segments, and plain-English report creation. Its BigCommerce Pro plan starts at $19 per month, includes unlimited AI queries, and offers a 14-day free trial with no credit card required. Store data synchronizes hourly and saved reports refresh automatically, so treat the dashboard as regularly updated reporting rather than a real-time transaction ledger.
Don't judge success by whether every customer becomes a frequent buyer. Judge it against the products you sell, the buying cycle customers reasonably follow, and your own comparable historical cohorts.
Your next useful outcome is a trustworthy repeat-buyer list and a clear action for one customer group. Build that before expanding the dashboard.
Chartsy brings BigCommerce sales, product, and customer data into customizable dashboards so you can investigate repeat purchases without rebuilding complex spreadsheets. Visit Chartsy to create a report showing repeat buyers, their order frequency, and the products they return to buy.

Written by
Chartsy TeamAnalytics team at Chartsy
The Chartsy Team writes guides, product updates, and resources to help SaaS and eCommerce founders make sense of their metrics, without SQL or spreadsheets.
Chartsy