
You check your dashboard and see 500 orders this month, up from last month, so you'd expect good news. Then someone asks a simple question. Are more customers coming back, or are you just winning more one-time buyers?
Most dashboards can't answer that from orders and revenue alone. BigCommerce customer reports can help, but only if you know which number you're reading, where it came from, and what it leaves out. Orders, customers and net sales often move in different directions, and guest checkout, discounts and refunds are usually why.
Table of Contents
- Which Report Answers Your Customer Question
- Reading the Customers Report Field by Field
- Why Guest Orders Make Customer Counts Misleading
- Gross Sales, Net Sales and Order Totals Explained
- How to Build a Net Sales Report by SKU
- Where to Find the Answers to Four Everyday Questions
- Choose Native Reports or a Reporting Tool
Which Report Answers Your Customer Question
A month with 500 orders can hide two very different stories. One loyal customer placing five orders and five new customers placing one each produce the same order count, yet they call for different marketing spend and different merchandising decisions.
BigCommerce data comes in layers, and picking the right layer is the first step. Customer records tell you who bought. Order records tell you what each transaction totaled, when it happened and what status it reached. Order product line items break each order into individual products, each with its own SKU, variant and price.
Matching the source to the question
| Source | What it covers | Best for | Main limit |
|---|---|---|---|
| Customers report | Customer counts, new versus returning customers, customer records | Customer behaviour and repeat purchasing | Built on orders, so guest orders are grouped together |
| Order list and exports | Order totals, dates, status, shipping and billing details | Revenue checks and order reconciliation | SKU-level totals need extra work |
| Order product line items | Product, SKU, variant, quantity, discounted total and refunded quantity | Net sales by product, SKU or variant | Needs order dates and customer fields joined in |
| Chartsy e-commerce analytics | Plain-English questions, charts and dashboards | Questions you repeat or compare often | Results depend on the store data connected to it |
Apply this to a real question. "Did repeat buyers grow this month?" is a customer behaviour question, so it starts in the Customers report. "Which SKU earned the most after refunds?" is a product money question, so it starts in line items. "How do this week's returning customers compare to last week's?" is the same question asked on a schedule, and recurring questions like that are where a reporting tool saves the most time.
Practical rule: Name the source that answers your question before you build anything. If you can't name it, you're guessing.
One thing sits underneath every row of that table. BigCommerce customer metrics are order-based, built from purchasing activity rather than from a separate database of everyone who has ever browsed your store. A customer only exists in the reports once they place an order, which is why guest checkout and repeat purchasing can distort the counts. For a broader view of how these layers fit together, see our guide to BigCommerce analytics and reporting layers.
Reading the Customers Report Field by Field
The Customers report works over a period you select, and for that period it separates unique customers, first-time customers, the share who are new and the share who are returning. The BigCommerce Customers Report support article lists customer type, cohort, first-order channel attribution, last order date and amount, lifetime order count, lifetime spend, days since last purchase, average order value and purchased-item price range on each customer record.
| Field | What it tells you | Question it helps answer |
|---|---|---|
| Unique customers | Distinct customers placing orders in the period | How many people bought this month? |
| First-time customers | Customers whose first order falls in the period | How many new buyers did we win? |
| New-customer percentage | Share of customers buying for the first time | Is growth coming from new buyers? |
| Returning-customer percentage | Share of customers on a later purchase | Are buyers coming back? |
| Cohort | Span between first and most recent order | How long do customers stay active? |
| First-order channel | Channel that brought the first order | Which sources bring customers who return? |
| Lifetime order count and lifetime spend | Total orders and total spend per customer | Who are the highest-value buyers? |
| Days since last purchase | Time since the most recent order | Who is at risk of lapsing? |
| Average order value and price range | Typical basket size and range of item prices bought | How big are typical baskets, and are buyers spending at similar price points? |
Cohort sounds technical, but it is the span between a customer's first and most recent order. A customer counts as returning when an order is their second or later purchase, and as new when it's their first.
A hypothetical customer, read in full
Say a customer's first order was 3 March and their latest was 12 June, as a hypothetical example. Their cohort span is about three months, and their days since last purchase count forward from 12 June. Neither field alone tells you much, so read them together.
A high returning share alongside low lifetime spend means loyal buyers are placing small baskets, which points you toward basket-building offers rather than retention work. A long gap since last purchase alongside high lifetime spend flags a valuable customer worth a win-back email before they lapse for good.
Three checks you can run on your own store today:
- Compare new and returning shares: Run the same period twice, once filtered each way, and see which group carries revenue.
- Sort by lifetime spend: Look at the top group and check their days since last purchase.
- Check first-order channel: See which channel's customers have the highest lifetime order count, not just the most first orders.
Why Guest Orders Make Customer Counts Misleading
The chart below shows how total orders and unique customers can tell different stories in the same month.
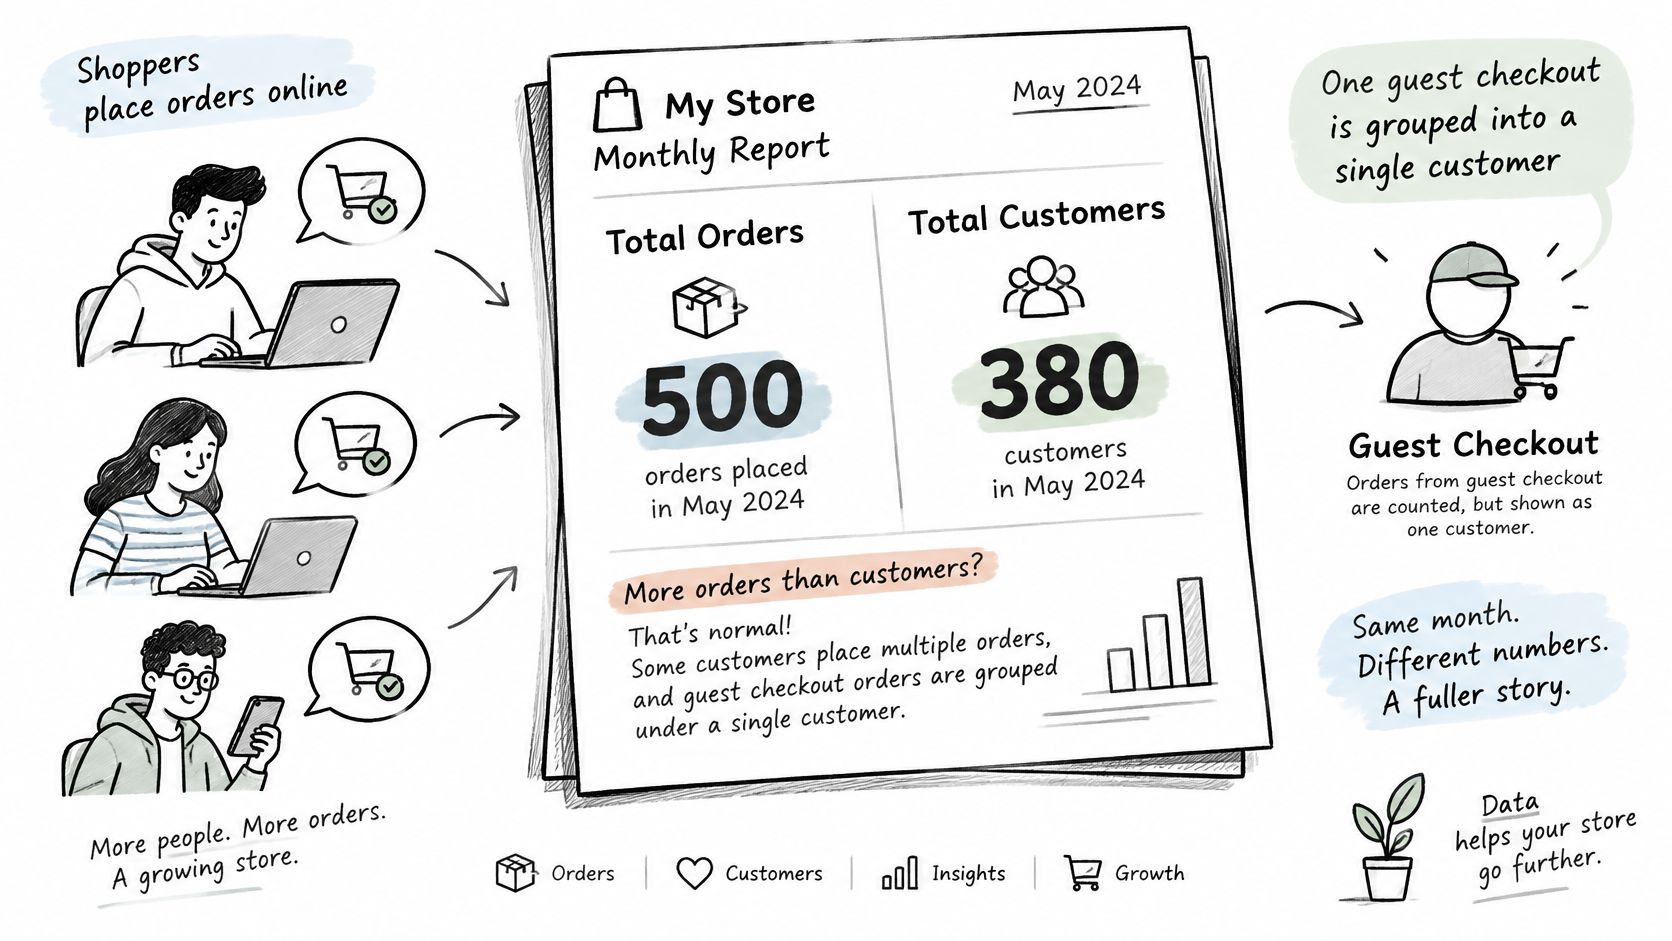
Say your store records 500 orders but only 380 customers in a month, as a hypothetical example. That gap doesn't always mean 120 people bought twice. The BigCommerce ecommerce analytics troubleshooting guide says guest orders are combined into an anonymous placeholder customer, which can make total customer counts lower than total order counts.
Think of a members' club visitor book where every guest signs under one shared name. The book shows one visitor no matter how many guests walked in. Your customer count works the same way when guest checkout is popular.
This distorts two figures at once. First, order growth can look like customer growth when it's really the same placeholder absorbing more guest orders. Second, returning-customer shares understate loyalty, because a guest who returns without logging in can't be matched to their earlier purchase, so they look new or unidentified.
Strong returning-customer numbers don't prove loyalty on their own. They may still understate retention when guest checkout splits one person's history across records BigCommerce can't connect.
The fix starts with a consistent definition. Decide how you'll identify a customer across guest and registered orders, for example by matching guest orders on email address where your privacy policy allows it, and label any figure built from orders as order-based. The first-order channel field shows which sources bring identified buyers who return, but only for customers BigCommerce can identify.
The short video below walks through how order and customer totals diverge.
Run three checks each month:
- Compare order count with customer count: A widening gap signals more guest buying.
- Track the share of guest orders: Note it beside every customer metric you share.
- Watch the anonymous share: Treat a rising share as a warning that repeat-buyer metrics are getting weaker, not stronger.
Gross Sales, Net Sales and Order Totals Explained
Picture a shop receipt. The prices printed beside the items are gross sales. Coupons taken off at the till are discounts. Money handed back later when something comes back is a refund. The tax line is collected for the government, not kept as your revenue.
Net sales are gross sales minus discounts and refunds. An order total is different again, because it can include shipping, handling and tax on top of the products. Our reference page on net sales for e-commerce stores sets out that definition in full.
| Metric | Includes | Leaves out | Common mistake |
|---|---|---|---|
| Gross sales | Item prices before discounts | Discounts, refunds and tax | Comparing it with net sales as if they were the same |
| Net sales | Gross sales minus discounts and refunds | Shipping and handling, depending on your definition | Forgetting to remove refunds issued in the period |
| Order total | Everything the customer paid on the order | Refunds issued later | Treating shipping and tax as product revenue |
| GMV | Total value of goods transacted through the platform | Platform fees and merchant costs | Reporting it as your own revenue |
| Profit | Net sales minus product cost and other expenses | Anything without cost data | Assuming net sales show profit |
Gross merchandise value, or GMV, is the total value of goods transacted through a platform. It's a useful scale measure at platform level. The BigCommerce fiscal-year 2024 results announcement reported $332.9 million in total revenue for fiscal 2024, an 8% increase from fiscal 2023, while customers generated 26% more gross merchandise value during Cyber Week from November 28 through December 2 than in the comparable five-day period a year earlier, with orders up 13% and average order value up 11%.
Notice how those figures sit in separate layers. Platform revenue, GMV, order volume and average order value each describe something different, and none of them is your store's sales, recurring revenue or profit. If you sell subscriptions or repeat billing through another system, that recurring revenue needs billing data from outside BigCommerce order records.
Net sales aren't profit either. Profit needs product cost and expense data that native order reports don't carry, so don't infer which products are profitable from sales alone. Write one definition for each term your team uses, and apply it the same way in every report.
How to Build a Net Sales Report by SKU
A SKU is the stock-keeping unit code that identifies one specific product variant, such as a medium blue shirt as distinct from a large blue one. Building net sales by SKU means working from line items, not order totals, because order totals blend shipping, tax and several products into one number you can't split reliably afterwards.
The four-stage overview below summarises the workflow before the detailed steps.
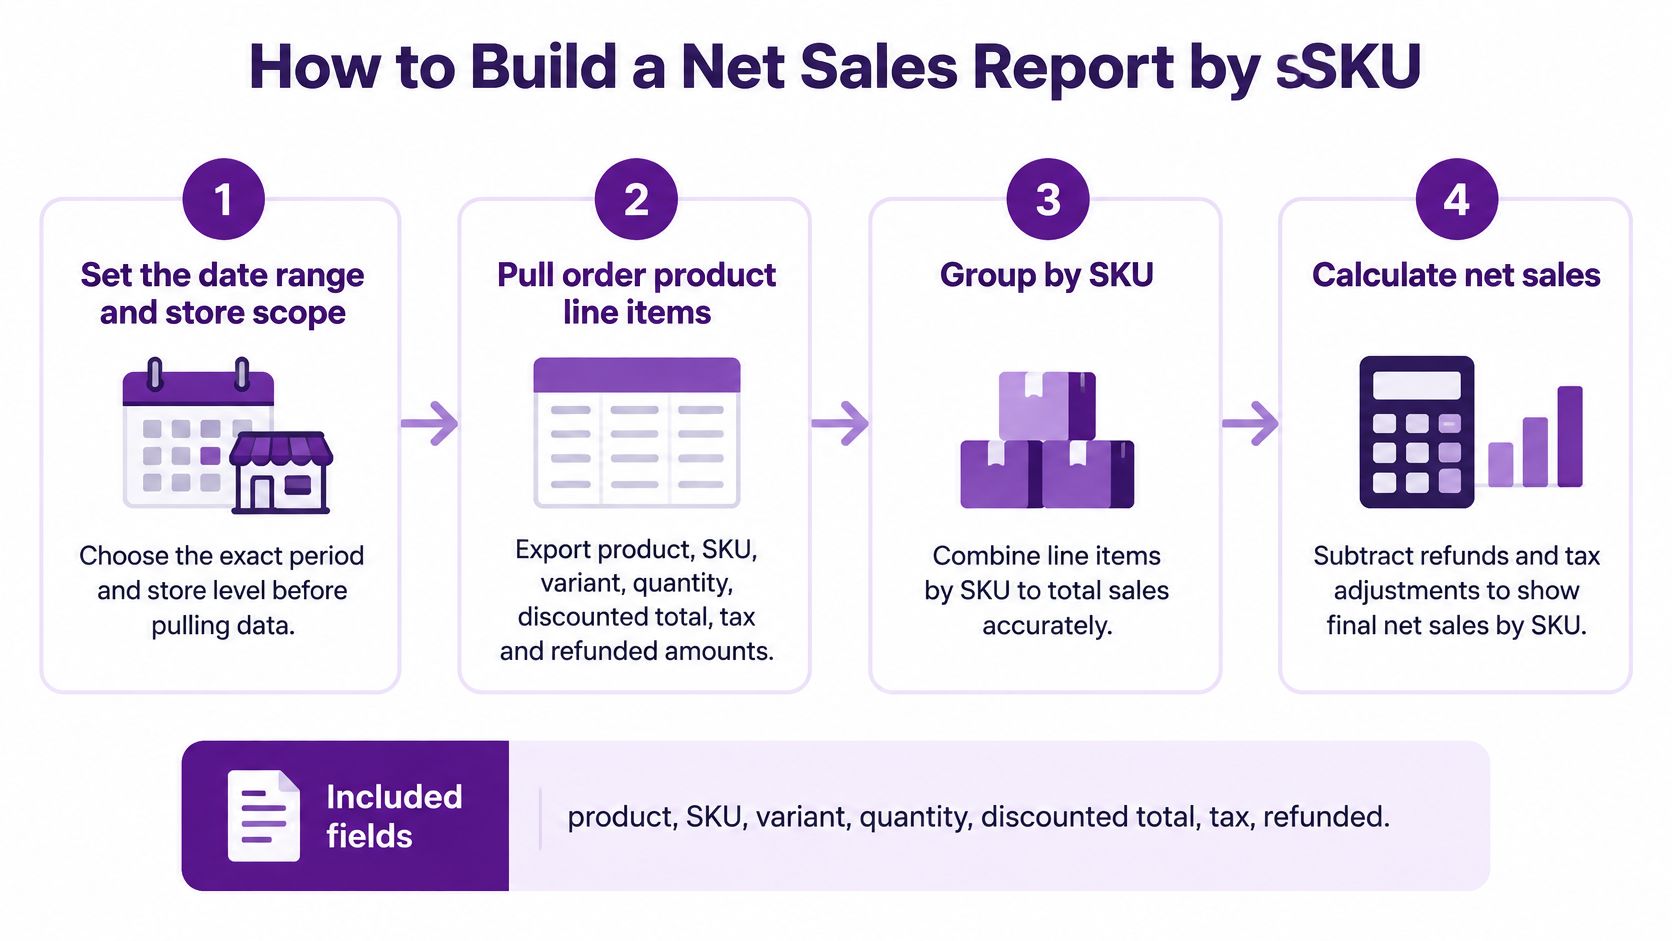
The seven steps
- Set the date range and store scope first: Decide the exact period and which store or channel you're covering before you pull anything, because changing scope halfway through makes totals impossible to reconcile.
- Pull order product line items for the period: Each line carries product, SKU, variant, quantity, discounted total, tax and refunded quantity. The BigCommerce order products API reference states that the discounted line-item value includes automatic, coupon and manual discounts, and that refund analysis should use the current quantity-refunded field rather than the deprecated line-item refund_amount field, because refunds don't update that legacy value.
- Use the discounted line total as your sales figure: Discounts are already inside it. Subtracting them again at line or order level double-counts them and understates every SKU that was ever promoted.
- Estimate refund value per line: Divide the discounted total by quantity to get a discounted unit price, then multiply by refunded quantity. Check the estimate against your refund records when you need exact amounts, since partial refunds and adjustments can differ from a simple unit calculation.
- Group lines by SKU or variant: Add up discounted totals and refund values within each group, then calculate net sales as discounted total minus refund value. Grouping by variant instead answers size and colour questions, such as which variants generated the most net sales last month.
- Keep non-merchandise refunds separate: Shipping, handling and gift-wrapping refunds belong in order-level refund records, not in product lines. Leaving them out of the SKU view stops return-heavy products looking worse than they are.
- Confirm your tax basis: Check whether your base prices include tax, then use that same basis for every period you compare. Mixing tax-inclusive and tax-exclusive figures makes a stable SKU look like it's growing or shrinking when nothing changed.
A hypothetical worked example
Say a customer buys two shirts at 20 dollars each with a 10 percent discount, as a hypothetical example. The discounted total is 36 dollars, so the discounted unit price is 18 dollars. If one shirt is refunded, the refund estimate is 18 dollars, leaving net sales of 18 dollars for that SKU from that order.
Notice what doesn't happen in that calculation. You don't subtract the 10 percent coupon a second time, and you don't use the original 20 dollar price for the refund. Both mistakes are common in hand-built spreadsheets, and both distort SKU rankings.
Reconcile the finished report against your order export for one month before you trust it. If the totals don't match, find the gap while one month is still small enough to check line by line.
Repeating these steps monthly by hand is where spreadsheet fatigue sets in. A reporting tool can turn the same fields into a plain-English question such as "Show net product sales by SKU after discounts and refunds for the last 30 days," and keep the columns and filters consistent each time you ask.
Where to Find the Answers to Four Everyday Questions
Most everyday questions aren't new problems. They're the Customers report or the SKU procedure pointed at a different slice, so the skill is routing each question to the right source rather than inventing a new method each time.
| Question | Where to look | What to watch for |
|---|---|---|
| Compare September and August sales by SKU | Line items for both months, grouped by SKU, with percentage change | Use the same tax basis for both months |
| Show sales and refunds by customer state | Order records by shipping state, with refund amounts from refund records | State reflects the delivery address, not the buyer's home |
| Which customers bought more than once this year | Customers report filtered to the year, lifetime order count | Guest orders may hide repeat buyers |
| Which variants earned the most net sales last month | Line items grouped by variant, net sales from the SKU procedure | Check the total against the order export |
For a September and August comparison, pull line items for both months and group by SKU using steps 2 to 5 of the net sales procedure, then place the two totals side by side with the percentage change. Percentage change is the difference between the months divided by the earlier month, so a SKU rising from 100 to 120 dollars in a hypothetical example shows 20 percent growth.
Routing the geography and repeat-buyer questions
For sales and refunds by customer state, take the shipping state from order records and attach refund amounts from refund records. Remember that the state reflects the delivery address, so a gift sent across the country lands in the recipient's state, not the buyer's. That's fine for shipping analysis, but it can mislead regional marketing decisions if you forget it.
For repeat buyers this year, filter the Customers report to the year and read lifetime order count for customers with more than one purchase. Questions about how to group those buyers into useful segments are covered in our guide to BigCommerce customer segmentation.
If you use a reporting tool for these questions, check each answer against your order export before sharing it with your team. Label any illustrative figure in a team update as a hypothetical example so nobody mistakes it for store data.
Choose Native Reports or a Reporting Tool
Stay with native BigCommerce reports and exports when you check a few figures each month and your questions rarely change. They're already connected to your store, and for a quick look at new versus returning customers or a single month's order totals, building anything extra costs more time than it saves.
Add a reporting tool when you ask the same questions repeatedly, need SKU, category and customer-segment cuts in one place, or want to share exports and dashboards with a team. The value isn't a prettier chart. It's not re-doing the discount and refund adjustments by hand every month.
Limits that stay the same either way
No tool removes the guest-order problem, because results depend on the store data connected to it. A tool also can't turn order totals into monthly recurring revenue, since recurring subscription billing that happens outside BigCommerce order records has to come from that billing system. If you're still weighing the platform itself, BigCommerce reviewed by KeenVerdict offers an independent assessment of where the platform fits different store types.
Our BigCommerce analytics lets you ask questions in plain English and get charts instantly, and it tracks revenue and product performance at store, category, product and SKU levels with exports to PDF or PNG. The BigCommerce Pro plan has a 14-day free trial with no credit card required, and can be cancelled anytime, so confirm current plan access and export formats on our pricing page before you sign up, since those details change.
A sensible three-step test:
- Connect the store: Use your real catalogue and order history, not sample data.
- Run one known question: Ask "Show net product sales by SKU after discounts and refunds for the last 30 days."
- Reconcile before you save it: Compare one month's result against your order export, and only save it to a dashboard once the totals agree.
If your BigCommerce customer reports leave you rebuilding the same net sales and repeat-buyer checks in spreadsheets every month, Chartsy lets you ask those questions in plain English and keep the answers as exportable reports and dashboards. Connect your store, run your SKU net sales question for the last 30 days, and check it against your order export to see whether it earns a permanent place in your reporting.

Written by
Chartsy TeamAnalytics team at Chartsy
The Chartsy Team writes guides, product updates, and resources to help SaaS and eCommerce founders make sense of their metrics, without SQL or spreadsheets.
Chartsy