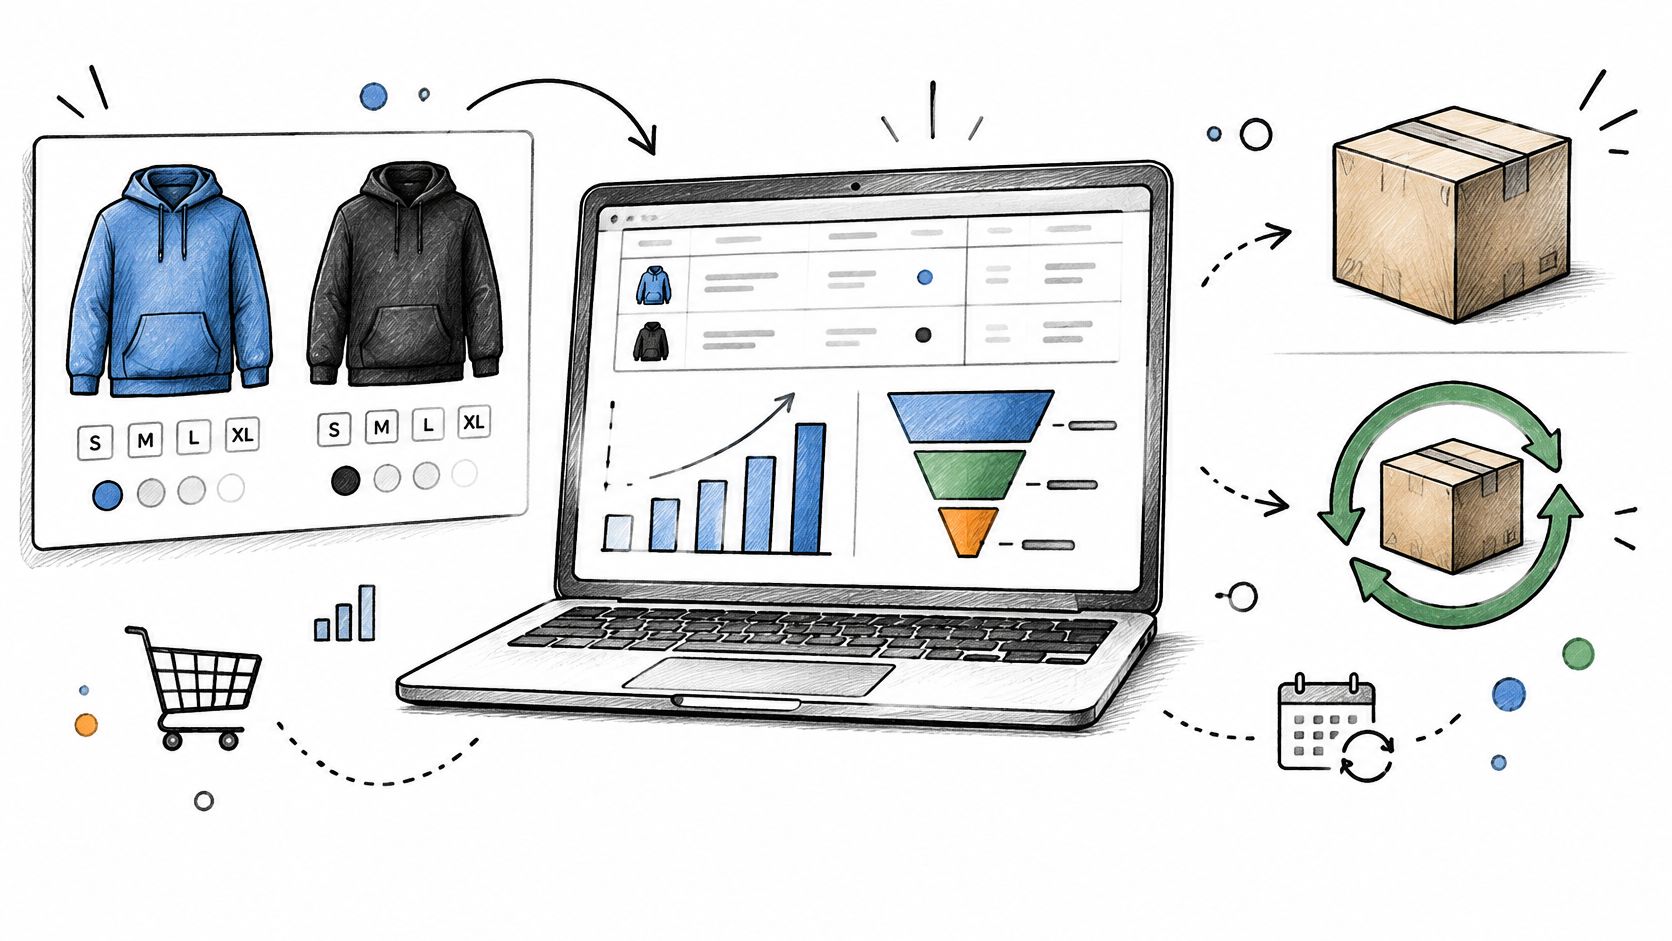
The usual advice for BigCommerce product variant reporting is to drill down to SKU level. That's necessary, but it won't make your revenue figures accurate on its own. A detailed ranking can still overstate sales if discounts, refunds, order statuses, and parent-product totals aren't handled consistently.
Table of Contents
- Why Variant Reports Mislead Store Owners
- Variant Metrics Worth Tracking and Why
- From Gross Sales to Net Sales for Each Variant
- How to Build a Variant Report Step by Step
- Limits That Change Your Variant Numbers
- Comparing Periods, SKUs and Customer Groups
- Native Reports, Exports and Reporting Tools Compared
- Keeping One-Time Sales Apart From Recurring Revenue
- Build Your First Variant Report This Week
Why Variant Reports Mislead Store Owners
Say you export orders and find Blue / Medium leading the sales chart. Then your finance total comes back lower than the sum of your variant rows. The problem isn't necessarily missing sales. You may be comparing different definitions.
Think of a restaurant menu: the parent product is the dish, while variants are its separately priced sizes and options. For merchandise, those sellable versions can also have their own stock records. A SKU is the unique code you use to identify a sellable version.
Three mistakes cause much of the confusion:
- Gross mistaken for net. Net sales means merchandise sales after discounts and refunds, not profit or the bank deposit.
- Parent and variant rows added together. The parent summarizes the variants; it isn't another sale.
- Single purchases mixed with renewals. The combined total hides which buying behavior generated the revenue.
AOV, or average order value, measures sales per eligible order. It's an order metric, so don't calculate it by averaging variant prices.
More detail helps you identify what sold. Consistent definitions tell you how much it actually generated.
Keep the scope on BigCommerce store orders and product data, not software subscription metrics. A useful reporting setup needs a small metric set, a reconciliation method, repeatable preparation rules, and separate views for different purchase types.
Variant Metrics Worth Tracking and Why
| Metric | Question it answers | Grouping level |
|---|---|---|
| Units sold | Which variants move the most stock? | SKU |
| Gross merchandise value | How much did each variant sell before adjustments? | Variant |
| Net sales | What did each variant keep after discounts and refunds? | Variant |
| Discount rate | Which variants depend on promotions? | Variant |
| Refund rate | Which variants come back most often? | SKU |
| Average selling price | Are buyers paying list price? | SKU |
| Share of product sales | How concentrated are sales in one size or colour? | Parent product |
| New versus returning buyer share | Who buys each variant? | Variant by customer type |
BigCommerce's product variants documentation defines variants as sellable versions with their own SKUs and inventory, and distinguishes regular variants from the virtual base variant representing the parent product. Use variant ID and SKU as reporting keys, with product ID retained for rollups.
Choose a definition before calculating
Units sold measures stock movement, but decide whether your column shows ordered units or units remaining after returns. Gross merchandise value captures merchandise value before your chosen adjustments; it isn't the amount ultimately retained.
For discount rate, divide allocated discount value by pre-discount merchandise value. For refund rate, choose either refunded value divided by sales value or returned units divided by sold units. Label the choice, because these answer different questions.
Average selling price should use actual order prices, not today's catalog price. Keep refund effects separate if you want to understand what shoppers paid at checkout.
- Product concentration. Divide a variant's units or net sales by its parent product's corresponding total. Don't mix a unit numerator with a revenue denominator.
- Customer mix. Classify customers at the time of purchase so a later repeat order doesn't rewrite their earlier buying history.
A hypothetical hoodie might sell most frequently in Large while also generating more returns in that size. That's a reason to investigate fit, not automatically reorder more.
For apparel teams coordinating online reporting with store operations, UI Lib's guide to size and colour tracking for retailers provides useful operational context.
Start with net sales, units, and refund rate. Add metrics when they answer a purchasing or merchandising decision, and set thresholds from your own history rather than treating them as universal benchmarks.
From Gross Sales to Net Sales for Each Variant
BigCommerce's Merchandising Report documentation describes revenue, orders, and quantity by product variation, with merchandising revenue based on line-item sale prices and order-level discounts. That makes it a useful merchandising baseline, not an automatic reconciliation to your finance team's net sales figure.
A hypothetical Blue / Medium calculation
Suppose you sell 10 units at $40 each, allocate $50 in discounts, and subsequently issue $80 in refunds for two returned units.
| Step | What to add or subtract |
|---|---|
| 1. Gross merchandise value | Line-item sale price times quantity: $40 × 10 = $400 |
| 2. Minus discounts | Order and line-level discounts allocated to this variant: $400 − $50 = $350 |
| 3. Minus refunds | Refunded amounts for returned units: $350 − $80 = $270 |
| 4. Net sales | Result after steps 2 and 3: $270 |
| Not included | Taxes and shipping, unless your finance definition adds them |
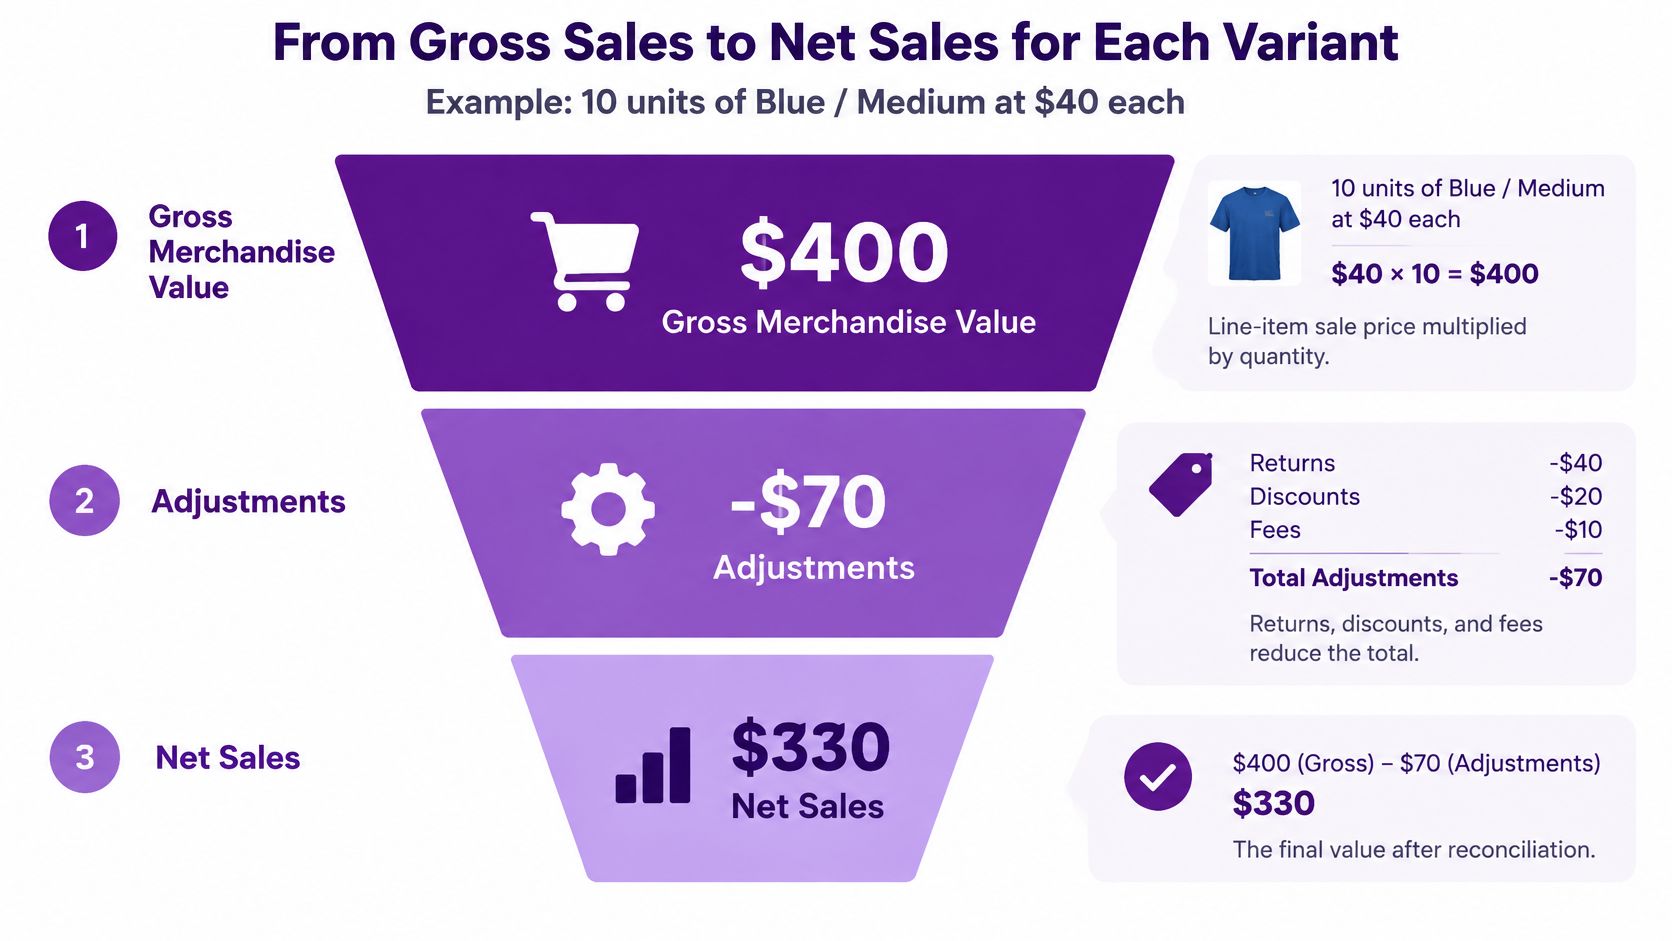
Use the actual merchandise refund amount, not returned quantity multiplied by list price. A discounted return may have a different refund value. Payment processing fees also belong outside this merchandise net sales calculation; subtracting them changes the measure.
An order-wide discount needs a documented allocation method. In a hypothetical mixed basket with a 20% discount, eligible lines receive the same percentage but different dollar deductions when their values differ. Prefer recorded allocations; otherwise allocate proportionally across eligible merchandise.
- Preserve eligibility. Keep order status so cancelled or unpaid orders don't enter the sales calculation.
- Choose refund timing. Decide whether refunds reduce their processing period or restate the original sale period.
- Separate profit. Net sales doesn't deduct product costs or operating expenses.
Agree on the net sales definition before comparing reports. A variant can lead on units and lose its lead after adjustments.
How to Build a Variant Report Step by Step
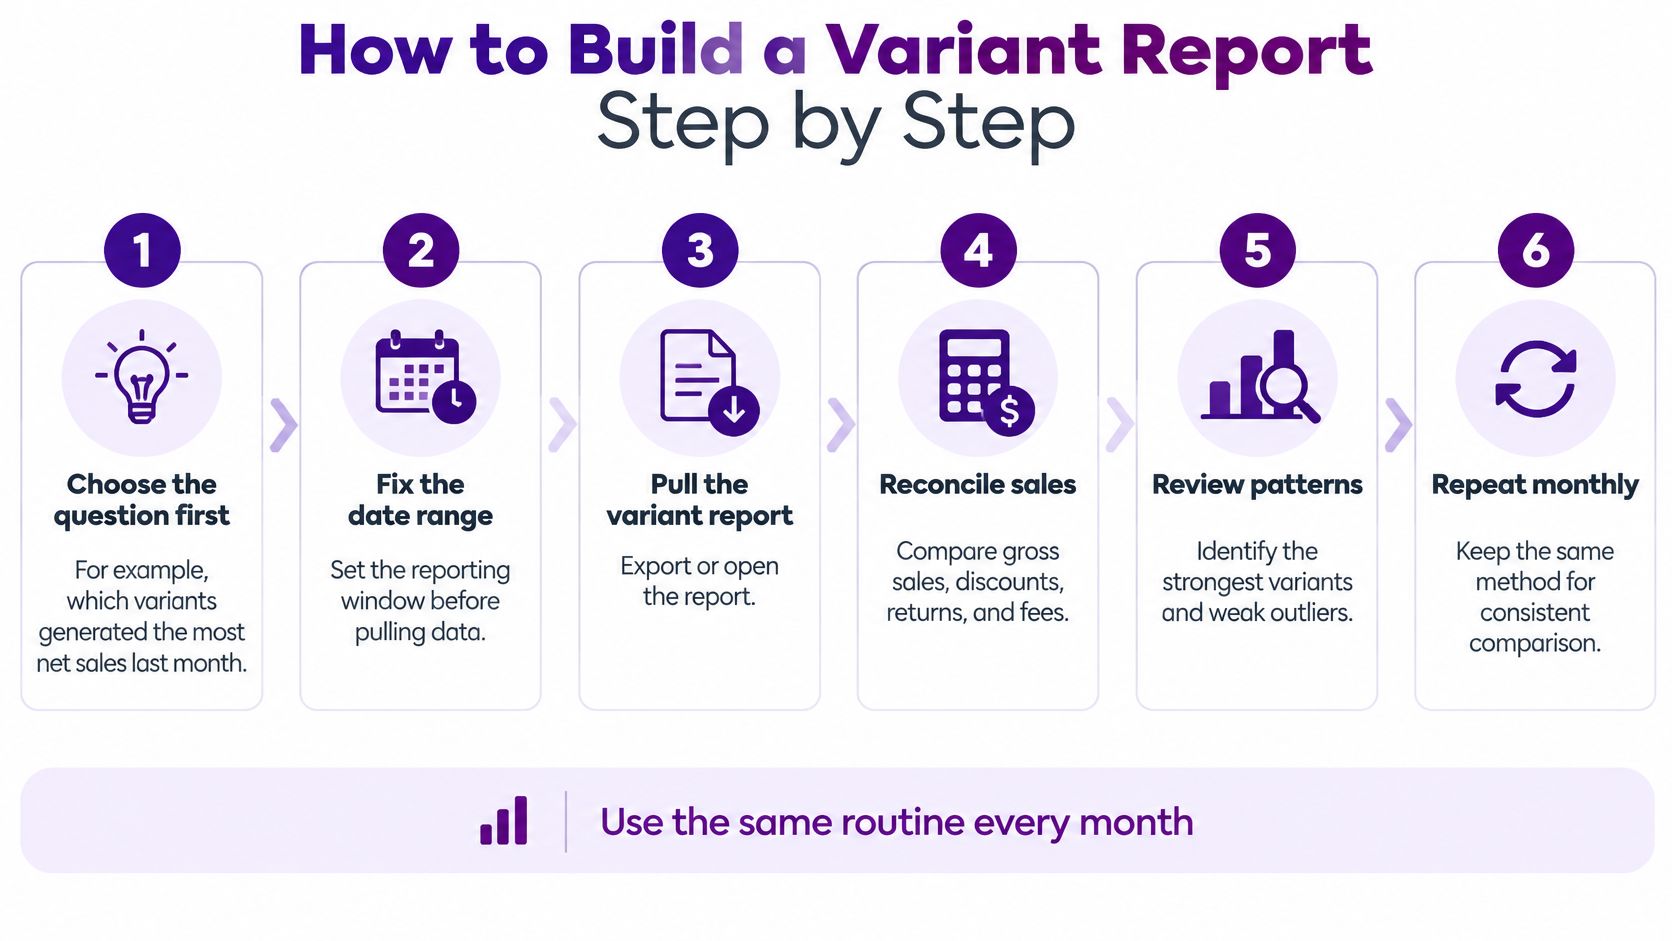
Use a repeatable monthly routine rather than rebuilding a spreadsheet from memory. Keep an untouched copy of the source records so you can investigate discrepancies without undoing your calculations.
-
Choose the question and reporting window. Start with “Which product variants generated the most net sales last month?” Record the exact start and end boundaries before retrieving data.
-
Open the native Merchandising Report for that same period. Capture the SKU-level baseline and its displayed date range. Don't assume a previously saved report uses your intended window.
-
Collect order-line detail. Use the Orders Report for investigation and an order export or appropriate data extraction for calculations. Request order ID, line-item ID, product ID, variant ID, SKU, option values, quantity, unit price, discounts, refund amount, timestamps, and status. Check which fields are available rather than assuming every export includes refund allocations.
-
Define eligible sales statuses. Exclude cancelled and unpaid orders, but don't assume only orders labelled Completed qualify. Paid orders awaiting fulfillment may belong in your sales definition.
-
Calculate line-level net sales. Apply the discount and refund treatment consistently before aggregation. Preserve unmatched refunds in an exceptions list instead of dropping them.
-
Group by variant ID and SKU. Put the parent-product total in a separate denominator column for sales share, not in the same additive column as variant sales.
-
Reconcile the grand total. Compare it with the store sales overview using equivalent dates and eligibility rules. Record differences attributable to refund timing, shipping, tax, or missing adjustments.
-
Save the column specification, filters, timezone, calculations, and exceptions. That specification is your reporting template, even if the actual work happens in a spreadsheet.
Turn the output into a stock decision
Review strong sellers alongside returns and availability before changing purchasing quantities. Once the figures reconcile, Sprello's resource on how to build a SKU-level assortment plan can help translate the report into an assortment review.
Keep reporting and purchasing separate enough that an unexplained sales spike doesn't become an automatic buying recommendation.
Limits That Change Your Variant Numbers
Finer SKU detail does not automatically produce more accurate revenue numbers. Platform limits decide what can be stored in the first place, and a report built on records the catalog refused to keep will mislead no matter how carefully you group it.
A variant appearing under different labels is usually an identity problem rather than a sales problem. Keep stable identifiers alongside readable names, and preserve the labels stored on historical orders when catalog options change. Reports keyed to the display name split one product's history into two lines every time a colour gets renamed.
BigCommerce's create product variant documentation sets limits of 600 SKUs per product and 255 characters per SKU. A hypothetical matrix of 10 colours × 60 sizes reaches 600 combinations, before excluding combinations you don't intend to sell. Once a product hits the cap, further combinations cannot exist as separate stock records at all.
Defining an option and its values doesn't by itself create the sellable variant records. Modifiers such as monograms or insurance behave differently again: they belong on the order as attributes rather than stock records, since they usually don't change the fulfilled variant.
| Symptom | Likely cause | Fix |
|---|---|---|
| Variant totals add up to more than the product total | Parent product counted alongside its variants | Report variants only; use the parent product only as a share denominator |
| Variant sales differ from finance totals | Gross used instead of net, or late refunds not yet matched | Apply gross-to-net calculations and filter by order status |
| One variant appears under two names | Inconsistent SKU format or changed option labels | Standardize naming, retain variant IDs, and respect the documented SKU length |
| SKU count grows with every customization | Modifiers treated as variants | Keep modifiers as order attributes rather than stock records |
| Daily totals shift between team members | Order timestamps use each viewer's browser timezone | Agree on one timezone and state it in every report |
| A product matrix will not add more variants | Product approaching the documented SKU limit | Audit the option matrix and remove unused combinations |
Keep attributes out of stock counts
An embroidery selection can explain an order's value without becoming a new inventory item. Preserve it as an attribute or adjustment linked to the purchased variant. Treating each personalisation as its own SKU inflates the variant list with combinations that will never be picked, packed or reordered, which makes every downstream count look busier than the warehouse really is.
Identity rule: Join records using identifiers. Use colour and size labels to make the report readable, not to decide whether two records represent the same item.
Comparing Periods, SKUs and Customer Groups
“Compare September and August sales by SKU” requires matched definitions, not adjacent charts. Put SKU first, then each period's units and net sales, followed by absolute and percentage changes.
Use identical order-status filters and timezone boundaries. Flag new and discontinued SKUs separately; a variant absent from the earlier period doesn't have a meaningful percentage growth rate.
Match the question to the records
BigCommerce's Customers Report covers new versus returning customers, spend, latest order dates, and customer details including total orders and average order value. It's useful for segmentation, but customer lifetime totals aren't automatically counts for your selected calendar year.
| Merchant question | Practical approach | Check before trusting it |
|---|---|---|
| Which customers made more than one purchase this year? | Count eligible orders by customer within the year; use customer profiles to investigate | Count distinct orders, not order lines |
| Show sales and refunds by customer state | Join location-bearing order records to sales and refund detail | Specify billing or shipping state |
| Show monthly sales by category, including discounts and refunds | Group reconciled merchandise lines by month and category | Document category mapping and prevent duplicate category assignments |
Use BigCommerce customer segmentation to frame meaningful groups, such as first-time versus established buyers, rather than comparing every customer in one blended total.
- Hypothetical comparison. Blue / Medium rises 12% in units but falls in net sales after refunds. The merchandising response should investigate returns before increasing the buy.
- Location caveat. A customer's current address may differ from the address on the order. Use the relevant transaction address for historical state reporting.
For customer comparisons, state whether returning means previously purchased before that order or purchased repeatedly during the selected period. Those classifications won't always produce the same result.
Native Reports, Exports and Reporting Tools Compared
| Option | Variant detail | Customer view | Best for |
|---|---|---|---|
| Native Merchandising Report | SKU-level sales with a customizable date range | Limited customer segmentation | Quick SKU-level checks |
| Native Orders Report | Order-level product summary with quantities and discounts | Order and customer search | Investigating a promotion or specific order |
| Native Customers Report | Not built around variants | New versus returning, spend, last order date | Customer-type patterns |
| Order exports | Line-item detail included in the selected export | Customer fields included in the export | Custom spreadsheet or BI analysis |
| Third-party reporting tools | Accessible fields and supported calculations | Supported customer dimensions and custom charts | Repeatable custom analysis without manual formulas |
BigCommerce's analytics reporting guide documents searches by customer, product, or order, including product searches by SKU and order searches by ID. It also describes order summaries with quantities and discount values, and notes that order timestamps follow the viewer's browser timezone rather than the store timezone.
Choose the least complicated adequate method
Native Analytics suits a quick operational check. Use the Merchandising view to find an unusual SKU result, then inspect relevant orders. Don't treat BigCommerce Insights, a separately named offering, as interchangeable with these native report screens; verify its current features before choosing it for a specific task.
Exports give an analyst control over joins and calculations, but the team owns the maintenance. A small catalog with a spreadsheet-confident operator may not need another reporting tool.
Third-party tools can reduce report-building work, but only when they expose the required dimensions and adjustments. Compare the supported metrics, export options, reporting flexibility, and total price using a real reporting question. The BigCommerce reporting software guide provides a relevant starting point.
- Test calculations. Request sales after discounts and refunds, not just a revenue chart.
- Test output. Confirm whether the export is a presentation image, a document, or reusable data.
- Test fit. Use BI platform insights from PlotStudio AI for broader evaluation context, then assess the actual store workflow.
A polished dashboard isn't a substitute for traceable totals.
Keeping One-Time Sales Apart From Recurring Revenue
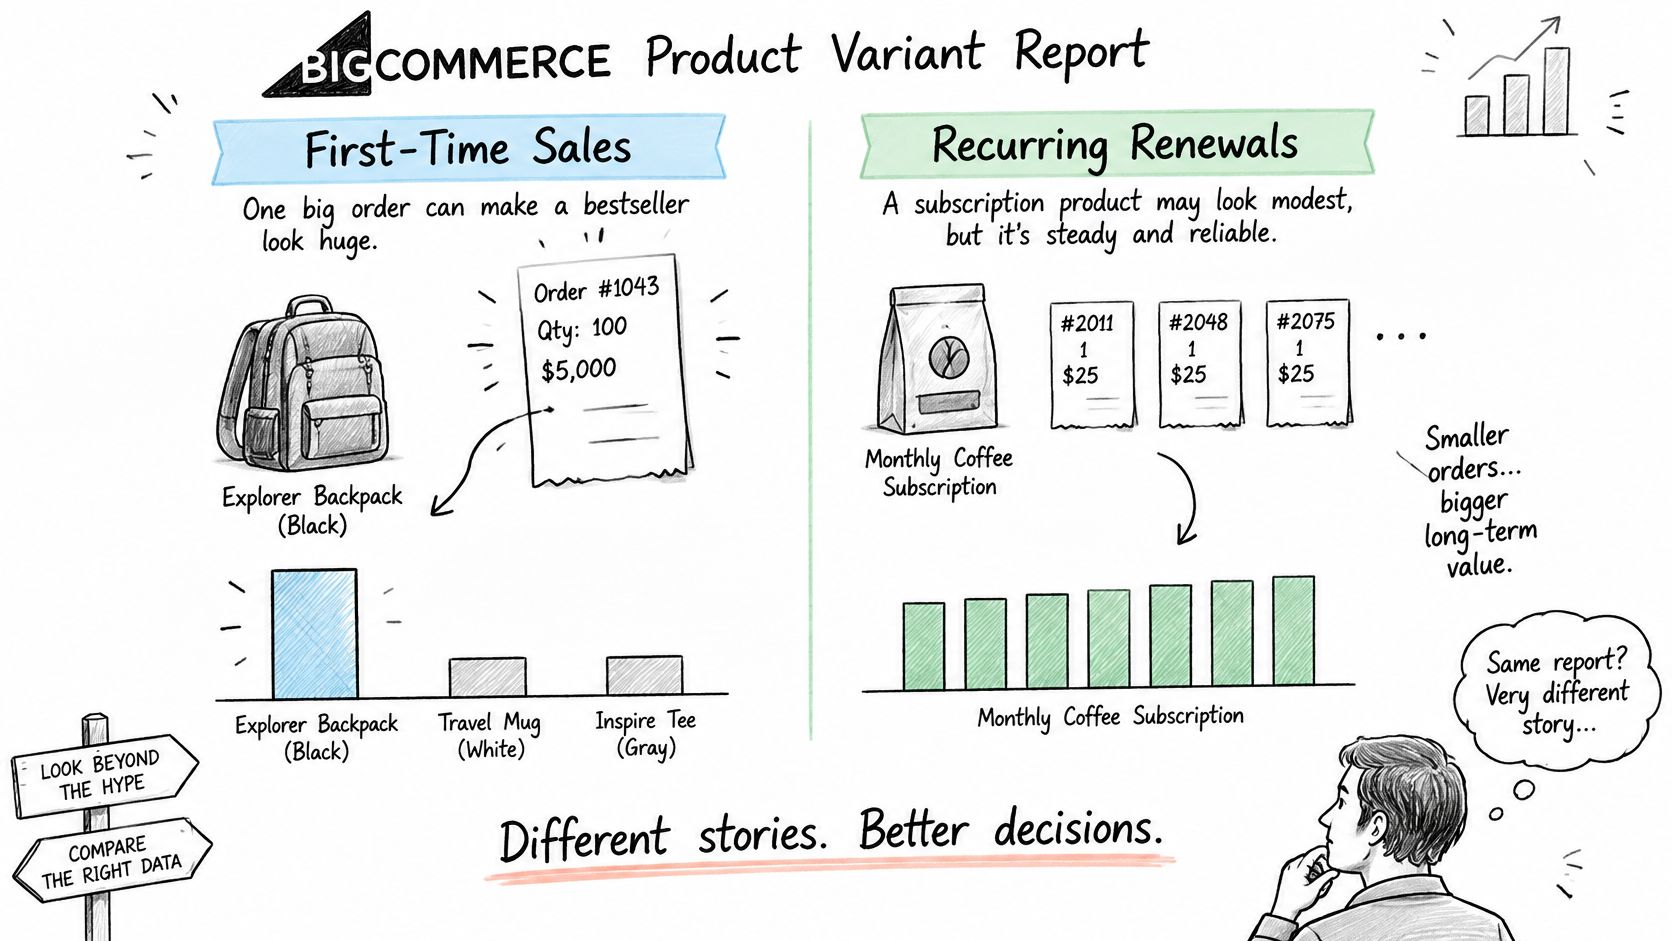
A bulk purchase can put a variant at the top of the chart without demonstrating repeat demand. Conversely, scheduled renewals spread across several variants can make an ongoing product relationship look weaker when you inspect each SKU in isolation.
One-time sales are single purchases. Recurring revenue comes from repeat charges for an offering that renews on a schedule. A customer placing another ordinary order isn't automatically a recurring-revenue customer.
Classify purchases explicitly
Use a purchase-type field from the system managing the recurring offering, then link it to the relevant order or line item. Product type or a maintained tag can identify the offering, but identifying a renewal may require additional source records.
- Separate purchase events. Distinguish ordinary purchases, initial recurring purchases, and renewal charges.
- Retain variant identity. Keep the purchased SKU and any predecessor relationship if customers change sizes.
- Use mutually exclusive views. Compare the groups over identical periods without counting the same order in multiple groups.
For a hypothetical store selling a three-month care plan in two sizes, separate new purchases from renewals for each size. That lets the merchant see whether apparent demand comes from acquisition or continued purchasing.
Order-level records show charges paid during a period. They don't establish normalized monthly revenue, cancellation behavior, or plan changes without the relevant billing records. Keep those questions outside the merchandise report.
Label the views by purchase type and date basis. Don't add overlapping views together or present a renewal-only chart as total store sales.
If the source data doesn't reliably identify renewals, mark purchase type as unknown rather than guessing from order frequency.
Build Your First Variant Report This Week
Build a report of the top ten variants by net sales for the last full month. Include units, allocated discounts, merchandise refunds, and the parent product so the ranking has enough context to support a decision.
Write down the date boundaries, timezone, eligible statuses, and refund timing before collecting records. Reconcile the complete variant total against the store overview before restricting the display to your top performers.
Choose a sustainable reporting workflow
Keep native reports and an order export if your team can maintain the calculation reliably. Consider a reporting tool when recurring preparation takes more effort than interpreting the results.
Our Chartsy BigCommerce analytics tracks revenue and product performance at store, category, product, and SKU levels, lets you ask questions in plain English and get charts instantly, and exports to PDF or PNG. The BigCommerce Pro plan has a 14-day free trial with no credit card required and can be cancelled anytime.
- Start narrowly. Test one variant ranking against known order records.
- Keep exceptions visible. Record unexplained differences rather than adjusting totals to make them match.
- Judge usefulness. Choose the method that produces a repeatable answer your team can explain.
Chartsy offers plain-English analysis and charts for exploring BigCommerce product and SKU performance without manually building complex spreadsheets. Visit Chartsy if you'd like to test a real question, such as which variants generated the most sales last month, then check the result against your agreed reporting definition.

Written by
Chartsy TeamAnalytics team at Chartsy
The Chartsy Team writes guides, product updates, and resources to help SaaS and eCommerce founders make sense of their metrics, without SQL or spreadsheets.
Chartsy