
The store total looks fine this week. Orders came in, the dashboard tile is green enough, and nobody has asked a hard question yet. Then a buyer writes about a jacket that keeps coming back, or a category that was busy last month goes quiet, and that store-wide number still looks acceptable.
That gap is the reporting problem. A headline total can hold steady while one variant, one discount-heavy category, or one shipping state carries the change. BigCommerce AI analytics is a way to ask that question in ordinary English and get a chart or table from orders, products, and customers, while keeping gross sales, discounts, refunds, tax, and net sales in separate columns. It is not a chatbot that repeats a vanity total, and it does not replace BigCommerce Analytics or BigCommerce Insights, which stay the native screens for standard sales and product views.
Table of Contents
- Questions Worth Asking Your Store Data
- Sales Definitions and Data Requirements
- Product SKU and Variant Reports
- Repeat Buyers and Quiet Customers
- Period Comparisons and Careful Forecasts
- Choose Your Source and Run One Question
Questions Worth Asking Your Store Data
Start with the slip you can name this week. A category buyer may be quieter. A color may be absorbing coupons. A handful of repeat customers may be holding up the month. The store total will not tell you which of those is true, because it mixes product value, discounts, tax, shipping, and later refunds into one figure that is easy to treat as success.
Ask the question in plain language, then point it at order lines, product records, and customer history. You want a table or a chart with named columns, not a sentence that restates revenue. Native screens are the right first look for standard product and sales views. Line-level questions need an order export or a saved custom report, because a single dashboard tile rarely carries variant, discount, and refund columns together.
| Merchant question | Where to start | Easy mistake |
|---|---|---|
| Which product variants generated the most net sales last month? | Order export or saved custom report by variant and SKU; native product analytics for a first look | Ranking by order total instead of sales after discounts and product refunds |
| Show monthly sales by category, including discounts and refunds. | Custom report or export with category, discount, and refund columns | Reading a category gross total as net sales |
| Which customers made more than one purchase this year? | Customer order history filtered by order count | Treating guest checkouts as separate people |
| Compare September and August sales by SKU. | The same SKU columns for both date ranges | Dropping SKUs that sold in only one month |
| Show sales and refunds by customer state. | Orders grouped by shipping state, with refund amounts beside sales | Using billing country or mixing tax-inclusive and tax-exclusive totals |
Variant net sales and a monthly category view that includes discounts and refunds both need line-level detail. Start with an order export or a saved custom report, not one tile. Repeat buyers come from customer order history, and guest checkout can split one person into several records if the email or customer ID does not match. A September-to-August SKU comparison only works when both months use the same columns and you keep SKUs that sold in only one month. Sales and refunds by state need the customer shipping region, with refund amounts sitting beside sales.
Store performance and marketing performance are related, but they are not the same report. If you also need to measure where ad spend pays off, keep that work in a marketing analytics practice. Order data can show the sales effect of a coupon or a known campaign window. It cannot, by itself, prove which ad click produced the order.
Circle one row. Use the rest of this guide only to read that answer without turning a total into profit.
Any store named later is hypothetical. The traps in the table are the ones that show up on a real Monday export.
Sales Definitions and Data Requirements
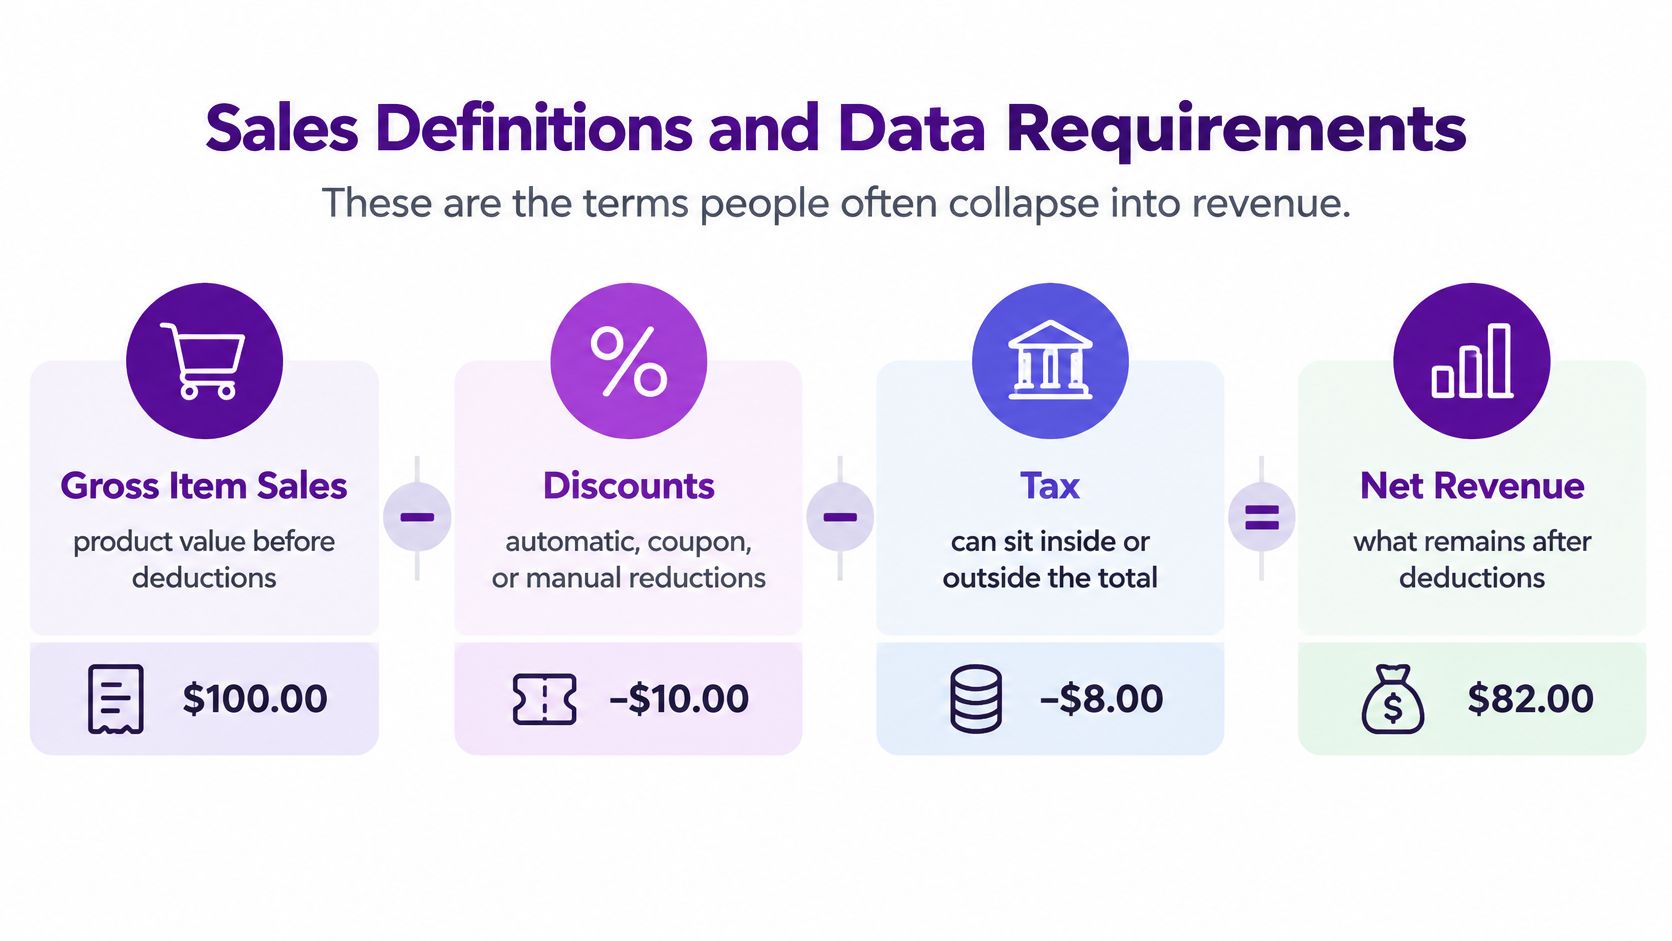
People collapse several labels into "revenue," then argue about a number that was never defined. Gross item sales is product value before deductions. Discounts, whether automatic, coupon, or manual, reduce that product value. They are not refunds. Tax can sit inside a tax-inclusive price or outside a tax-exclusive one, so two correct reports can disagree. Shipping charged to the customer is money on the order, and it is not product sales.
A refund is not automatically a negative product line. When the order data records the pieces, a refund can include product value, tax, shipping, handling, or an order-level amount. Net sales, for a merchandising report, usually means product sales after discounts and product refunds, with tax and shipping shown beside it and the basis named on the report. None of these figures is profit. Cost of goods is not in these fields, so the report stops before margin.
A month you can trace by hand
Say a small apparel store closes a hypothetical month with a $12,000 item subtotal excluding tax, $1,500 in discounts, $400 in product refunds, $900 in tax, and $300 in shipping charged to customers. Net product sales on this basis are $10,100 ($12,000 minus $1,500 minus $400). The $12,000 is neither net sales nor profit. If someone adds the tax and shipping back in and calls the result "what we made," they have mixed four different ideas.
The BigCommerce orders overview documents discount_amount, refunded_amount, subtotal_ex_tax, and subtotal_inc_tax as distinct order fields, with transactions, refund endpoints, and separate order-tax endpoints. A workflow can calculate product revenue, discounts, taxes, shipping, and refunds instead of trusting one store-wide number. Custom reporting can use those fields so a team is not rebuilding the same logic in a spreadsheet every Monday. A longer walk-through of native screens versus saved reports sits in this guide to BigCommerce analytics.
| Figure | What it includes | What to leave out |
|---|---|---|
| Gross item sales | Product amounts before discounts | Tax, shipping, and profit |
| Discounts | Automatic, coupon, and manual discounts | Refunds |
| Tax | Tax recorded on the order at the stated basis | Product revenue |
| Shipping | Shipping charged on the order | Product sales |
| Refunds | Product, tax, shipping, handling, or order-level amounts as recorded | An assumed negative product sale when other components were refunded |
| Net sales for reporting | Product sales after discounts and product refunds, with the basis named | Tax, shipping, and profit unless labeled separately |
Tax basis before you compare anything
Tax is readable, and it is easy to misread. The BigCommerce tax documentation says each tax on an order is read-only and can be retrieved by order ID, with details=true for extra tax information. Tax normally follows the store's tax rules unless automatic tax is enabled. With automatic tax enabled, BigCommerce does not calculate sales tax on orders created through the API. Tax-inclusive and tax-exclusive prices can also be supplied as overrides.
Two period reports can both be "right" and still not match if one uses tax-inclusive totals and the other uses tax-exclusive values, or if tax was calculated outside the store. Name the basis on the report.
Before you trust any chart, run a short pre-flight:
- Name the metric. Gross item sales, net sales, or something else.
- Name the dates. The same calendar rules for every column.
- Check refunds and tax. Inclusive or exclusive prices, and whether automatic or external tax applies.
- Then ask the question. Not before.
A PDF or PNG chart is a snapshot of that definition. It does not replace the definition. Saved dashboards follow the store sync rather than a live pull on every click, so confirm the refresh timing in current documentation before you treat yesterday's close as this morning's file.
Product SKU and Variant Reports
An order total is a poor brief for a merchandiser. The actionable line is the sellable item. A SKU is the store identifier for that item. A variant is one option combination under a product, such as size or color. Navy medium and black medium are two variants, often two SKUs, even when they share a product name.
A useful report needs a date range, category, product name, SKU, variant, quantity sold, quantity refunded, discount amount, the tax basis, and a net-sales-style total. The BigCommerce order products reference states that a line item's total can represent the amount after deducting all discounts and including tax, and that this value includes automatic, coupon, and manual discounts. The same records expose quantity_refunded, so units sold and units later refunded stay separate. Product tax is the difference between tax-inclusive and tax-exclusive prices, and manual discounts affect the taxable amount.
Why units and net sales disagree
Say a hypothetical jacket sells in navy and black under two SKUs during one month. Navy moves more units. Black is the color on the sitewide coupon, so a larger share of its product value is discounted, and a few units come back. Ranked by units, navy wins. Ranked by product sales after discounts and product refunds, black can fall behind even if the order count looked strong. A category view for that same month should keep discounts and refunds as their own columns. Otherwise a promoted category looks like stronger demand when it mostly absorbed a coupon.
Practical rule: If the ranking changes when you subtract discounts and product refunds, you were ranking activity, not net sales.
How to produce the report
Use native product analytics for the first look at what sold. When you need variant, discount, and refund columns together, export orders and build only that question. If the same filters will be reused, save a custom report with those columns and a named date range. Custom reports can put quantity, discount, tax basis, and refunded quantity on one table and compare two periods once the column list matches.
Keep SKUs with zero sales in one of the periods visible. Dropping them makes the remaining list look healthier than the assortment was. Do not infer which variant is most profitable. These fields do not contain cost, so a higher net-sales rank is not a margin rank.
Refund rate, if you show it, is refunded units divided by units sold for that SKU and date range, labeled as units rather than dollars. A dollar refund rate needs the product portion of the refund, not shipping or tax mixed in.
Repeat Buyers and Quiet Customers
"Who came back" is an order-history question. A new customer is someone whose first recorded order falls in the period. A returning customer has an earlier order on the same customer record. Guest checkout can hide one person across sessions, so a repeat-buyer count is only as reliable as the email address or customer ID behind it.
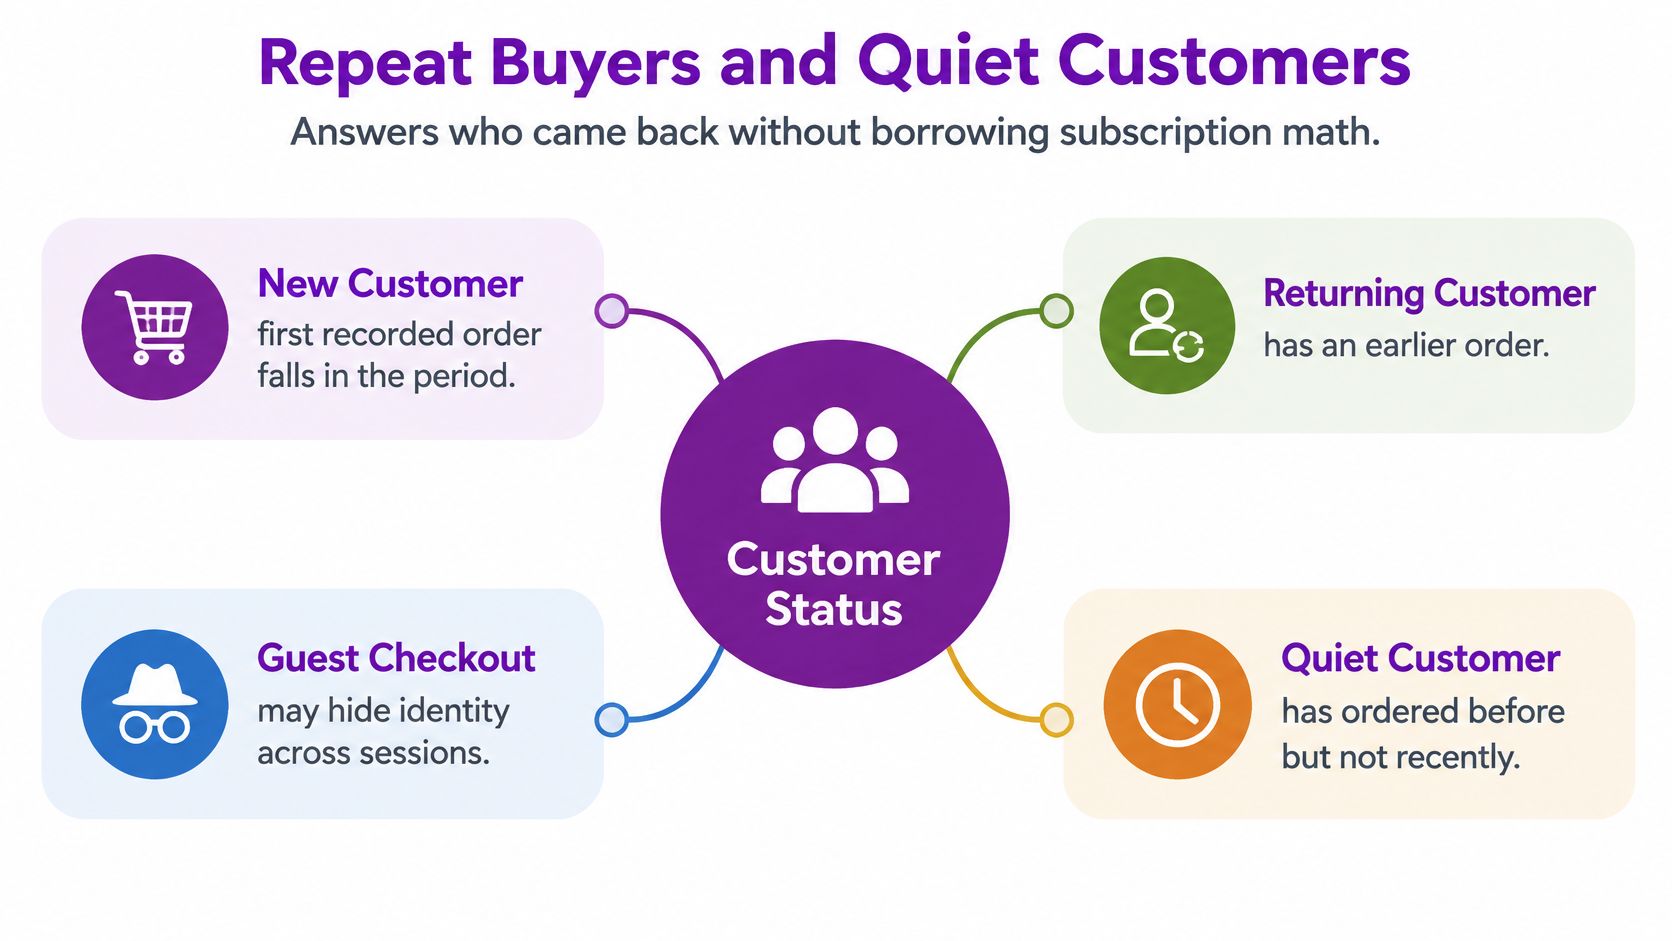
Report four patterns, not a single loyalty score: order count, amount spent, days since the last order, and whether a second purchase happened this year. Recurring revenue here means money from repeat purchases in the store. It is not monthly recurring revenue. Churn, subscriber, and plan formulas do not belong on this report, and neither does customer lifetime value unless you have a named definition and the cost data to support it. Most store teams do not, so leave lifetime value off the page.
A short briefing on reading repeat purchase patterns without turning them into a subscription dashboard helps before you build the list. The same idea is laid out in this guide to BigCommerce customer reports.
Four groups you can build from orders
You can group customers from an order export in a spreadsheet, or check that a saved segmentation uses the same rules before you rely on it.
- Loyalists: They buy often and recently. Sort by order count and a recent last-order date.
- Promising buyers: They are building a habit, often a second or third order this year, but the pattern is still short.
- At-Risk buyers: They ordered before and have gone quiet. Pick a silence window your category can defend, such as 90 days for replenishable goods.
- Lost buyers: They stopped. Their last order sits beyond that window, and they have no purchase this year.
Ask two questions in sequence. Which customers made more than one purchase this year? Which of last year's Loyalists have had no order in 90 days? The first list is your repeat-buyer set. The second is the quiet group worth a retention email, not a blanket blast to everyone who ever checked out.
If you want a spoken walk-through of how order history gets misread as loyalty, this briefing covers the same split between a recorded customer and a guest record.
Save or export the segment, send the email, then judge the result by later repeat orders in the store data. Do not claim those orders prove an advertisement worked. The order shows that someone bought again. It does not show which message, if any, they saw.
Period Comparisons and Careful Forecasts
Changing the date range is easy. Keeping the meaning is the work. Hold the metric, the tax basis, the category rules, and the filters constant. If September net sales use product value after discounts and product refunds, August must use that same definition. A tax-inclusive September beside a tax-exclusive August is not a comparison.
For September versus August by SKU, use the same SKU list, including SKUs with zero in one month. Dropping a discontinued item makes the remaining list look healthier. For categories, keep discounts and refunds visible so a promotion is not mistaken for demand. A category that "grew" because a coupon deepened is a pricing story, not a demand story.
For customer groups, compare new and returning sales on the same net-sales basis. Growth that is mostly first orders is acquisition. Growth that is mostly second orders is repeat buying. Those two results ask for different next actions, and a blended total hides which one you have.
What a careful forecast is allowed to say
Treat marketing performance as something the order can show: the sales effect of a coupon, a discount, or a known campaign window. That is not an ad-click attribution model, and this guide does not invent one. If you need click paths, that work lives outside the order export.
A careful forecast is a reading of recent history. If net sales by category are steady for six months after refunds, next month is unlikely to jump unless a known season or promotion is coming. Label that a projection, not a promise. Write the assumption next to it, such as "same mix, no new promotion."
Say what the data cannot forecast. It cannot forecast inventory, because stock and lead time are not in the sales fields. It cannot forecast profit, because cost is absent. It cannot forecast advertising return, because the order does not carry a verified click path.
One customer, one product, or one shipping state can move the total. Read state-level sales and refunds beside the tax rules and any shipping refunds, not as a clean league table of "best states." A state that leads on tax-inclusive totals may look ordinary once tax and shipping refunds sit in their own columns.
Choose Your Source and Run One Question
Pick one row from the opening table. Two defaults cover most weeks: which product variants generated the most net sales last month, or how September sales by SKU compare with August.
- Write the metric, tax basis, and date range before you open any report. For the variant question, that is product sales after discounts and product refunds, tax shown beside it, last calendar month.
- Check BigCommerce Analytics or Insights for the standard view. It is the fastest first look, and it is often enough to see which products moved.
- Export orders only if that view is missing variant, discount, refund, or state columns. Rebuild that one question in a spreadsheet. Do not rebuild the whole store.
- If the team will ask it again, choose where the saved version should live. A one-off check can stay in the native view or the sheet. A question you will reopen belongs in a saved custom report.
| Source | Best for | Limits |
|---|---|---|
| BigCommerce Analytics | Standard store views for a first look | Column set may not include variant, refund, or state detail |
| BigCommerce Insights | Standard reporting views and trends | Check exact columns before relying on it for line-level questions |
| Order export | Line-level detail with discounts and refunds | Comparisons need spreadsheet work |
| Chartsy custom report | Repeat questions with saved columns and plain-English prompts | Requires a connection and current plan terms; verify before use |
BigCommerce AI analytics fits when the same question returns every week and you would rather ask it in plain English than rebuild columns. A native view or a spreadsheet is the better fit for a single check you will not save. If you are weighing outside store research, such as AdLibrarySpy competitor research features, keep that separate from your order file. Competitor ad libraries do not replace your discounts, refunds, and tax columns.
Our BigCommerce analytics lets you ask questions in plain English and get charts from the connected store data. The BigCommerce Pro plan starts at $19 per month billed monthly or $190 per year billed yearly, with a 14-day free trial, no credit card required, and cancellation anytime. Confirm those terms on the plan page before you start, because access and history options can change. For the technical shape of an order export versus a saved report, see the notes on BigCommerce API reports.
Reopen that one saved report next Monday. Do not export the whole store again, and do not expect the report to promise higher sales, faster growth, or a complete view of advertising.
Chartsy helps you ask a precise store question and keep gross sales, discounts, refunds, tax, and net sales in separate columns, then save the chart instead of rebuilding the spreadsheet. If variant net sales or a September-to-August SKU comparison is the question on your desk, that is the report to build first. Visit Chartsy when you are ready to connect the store and run that one question.

Written by
Chartsy TeamAnalytics team at Chartsy
The Chartsy Team writes guides, product updates, and resources to help SaaS and eCommerce founders make sense of their metrics, without SQL or spreadsheets.
Chartsy