
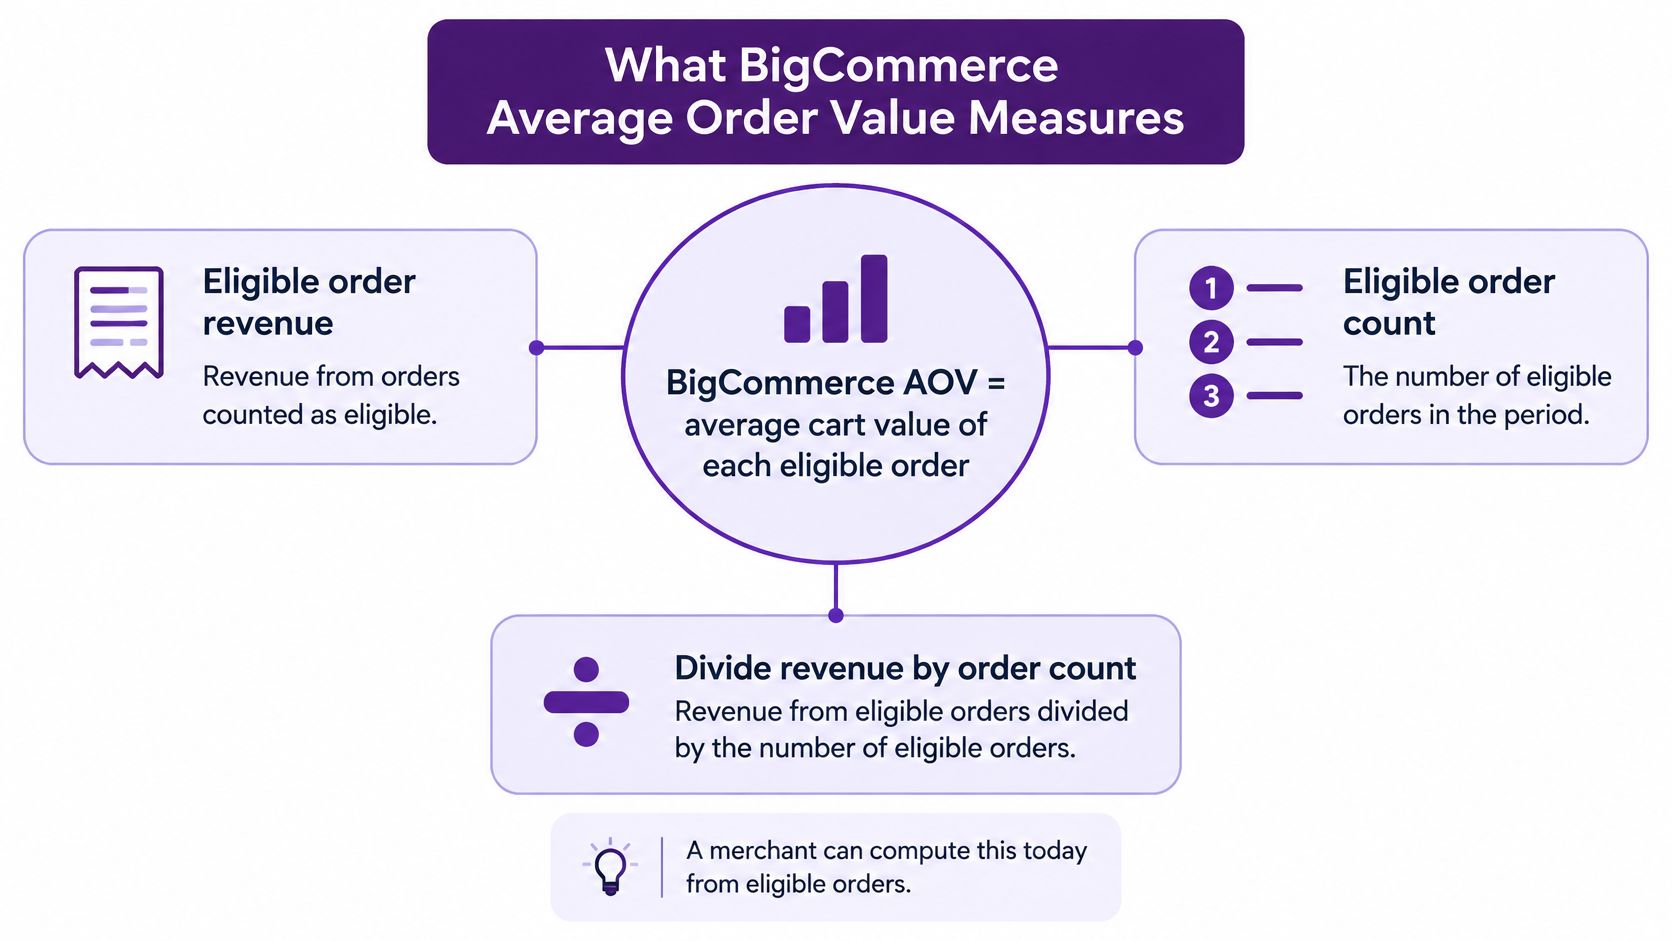
On BigCommerce, average order value is the average cart value of each eligible order: revenue from eligible orders divided by the number of eligible orders. The Store Overview figure built on that definition excludes returns and refunds, so it measures the value of completed checkouts, not the cash a store keeps after a shopper sends something back.
That one exclusion explains most of the arguments about the metric. An owner reads a rising number on the dashboard and calls it a win. Whoever handles the books reads the same month, sees discounts and refunds eating into it, and reports something flatter. Both are working from real store data. They're just reading two metrics that share one name.
This guide starts with the platform definition, then builds the second view beside it: what belongs in the numerator, what to leave out, and how to compare two periods without tripping over shipping fees, tax, coupons, or subscription renewals.
Table of Contents
- What BigCommerce Average Order Value Measures
- Discounts Refunds Tax and Shipping in the Average
- A Hypothetical Month of Orders
- How to Read AOV in BigCommerce Reports
- Benchmarks Worth Using and Ones to Ignore
- When a Higher Average Is Not Better
- Practical Ways to Raise Average Order Value
- Build a Repeatable AOV Report
What BigCommerce Average Order Value Measures
Start with the definition rather than the dashboard, because the definition is narrower than commonly assumed. BigCommerce's own help documentation describes average order value as the average cart value of each eligible order, calculated by dividing revenue from eligible orders by the number of eligible orders, in the Ecommerce Insights guide.
The formula: AOV = revenue from eligible orders ÷ number of eligible orders
Two words carry the weight. Eligible means the order passes the status filter the report is using. Revenue means the value of those orders as recorded, before later post-purchase adjustments. The standard Store Overview calculation excludes returns and refunds, which turns the figure into completed-order value rather than net customer spend.
That distinction matters most when you compare BigCommerce average order value across periods, stores, product groups, or customer segments. If the refund rate moves between the two periods, the comparison drifts even when no shopper changed their behavior.
Reading the number beside its neighbours
The platform places AOV next to orders, revenue, customers, visits and conversion rate, and that arrangement is doing real work for you. Those five columns separate two different growth engines: more transactions, or more value per transaction. Read alone, the average can't tell you which one moved.
The two-line test: Revenue up with orders flat means basket size explains the gain. Orders growing faster than revenue means the average fell even though sales rose.
A small illustration, not a benchmark. Suppose a store takes $12,000 from 80 completed orders. The average is $150. Spread the same $12,000 over 120 completed orders and the average is $100. The catalogue didn't change. The mix of order sizes did.
The customer-level half of the picture
Customer reporting adds total spending, order count, last purchase date and a customer-level average for each buyer. That last column answers a question a single store figure can't. Is the $150 a broad pattern across most buyers, or a handful of large orders pulling up a much lower typical order?
A store-wide average is a starting point, not a verdict. The rest of the work is defining the inputs precisely and then splitting the result by product, variant, customer and region until the number explains itself.
Discounts Refunds Tax and Shipping in the Average
Store Overview AOV divides order revenue by eligible orders and leaves returns and refunds out. That makes it a gross checkout benchmark, not a measure of realized revenue. A store can hold a steady average all year while the money it keeps drifts downward.
Building the second view takes one deliberate step. Divide net merchandise sales (eligible revenue minus refunded product) by the same eligible orders, then label the result as your own calculation rather than a BigCommerce metric.
Discounts are where most net calculations go wrong. BigCommerce's order-product data includes a discounted_total_inc_tax value for each line, representing the amount after all automatic, coupon and manual discounts, including tax. The order products API reference notes that the value can be used for accounting without deducting line-level or order-level discounts again. Subtract the coupon twice and your net sales understate what shoppers paid.
| Component | Store Overview AOV | Net report | Note |
|---|---|---|---|
| Eligible completed orders | Denominator | Same orders, statuses held fixed | Changing status filters changes the average |
| Revenue from those orders | Numerator | State whether it's merchandise or order total | Match the date field every period |
| Line after automatic, coupon and manual discounts | Included when revenue is after discounts | Use discounted_total_inc_tax | Do not subtract the coupon again |
| Discount dollars | Hidden inside a lower total | Own column | Needed to see promo cost |
| Shipping, handling, gift wrapping | Included only if your revenue definition includes them | Split from merchandise AOV | A shipping threshold can move AOV without a bigger basket |
| Tax | Often inside inc-tax totals | Own column | A tax change isn't a merchandising gain |
| Refunds and returns | Excluded | Refund amount, refunded tax and net sales beside AOV | A stable AOV can hide weaker kept sales |
| Subscription or repeat orders | Each eligible order counts once | Do not annualize into one customer figure | A renewal is another order, not monthly recurring revenue |
Use that table as a checklist before anyone quotes a comparison. Shipping, handling and gift wrapping lift an order total without a bigger basket, so show a merchandise average next to the order-total average. Tax stays in its own column, because a rate change isn't a merchandising gain. Refunds sit beside the average rather than inside it, and a renewal counts once as its own order, never annualized into a customer figure. Write down the numerator, the order statuses and the tax treatment before the first period comparison, not after an argument about it.
A Hypothetical Month of Orders
Here's a hypothetical month for a home-goods store, chosen so every figure is easy to check. The store closes 100 eligible completed orders. Merchandise before discounts is $18,000. Automatic and coupon discounts total $1,500, so shoppers paid $16,500 for product. Shipping collected is $800 and tax is $1,200.
Nothing about demand changes across the next three numbers. Only the definition does.
- Gross order total AOV: $18,000 minus $1,500, plus $800 shipping and $1,200 tax, is $18,500. Divided by 100 orders, the average is $185.
- Merchandise AOV after discounts: $16,500 divided by 100 orders is $165.
- Net merchandise view: $16,500 minus $900 of refunded product is $15,600, or $156 per order on your own calculation.
Now let 8 of those orders come back. The store refunds $900 of product, $70 of tax and $40 of shipping. On the merchandise definition, net sales land at $15,600.

Where the refund mechanics live
BigCommerce lets you price a refund before you create it. The refund documentation explains that a refund quote calculates the tax amount and total refund amount first, and that refunds can then be applied by product or gift-wrapping quantity, or by amount for shipping, handling, fees, or an order-level partial refund. One documented example totals $20.83, made up of $0.83 tax, $10.00 shipping, and product cost. Three components, three columns.
Store Overview AOV still divides by the original eligible orders, because refunds are excluded there. Pushing the $1,010 of refunds into the divisor would invent a third metric with no name and no comparison set.
What the blend hides
Of the 100 orders, 30 are subscription renewals at $40, or $1,200. The other 70 average about $219 on the $165 merchandise base. The blended $165 conceals both patterns at once.
Customer concentration hides there too. If 15 buyers placed 40 of those orders, the customer-level average is the next cut, then product variant, then customer state.
| Definition | Numerator | Divisor | Result |
|---|---|---|---|
| Gross order total AOV, includes shipping and tax | $18,500 | 100 eligible orders | $185 |
| Merchandise AOV after discounts | $16,500 | 100 eligible orders | $165 |
| Net merchandise view after refunds, own calculation | $15,600 | 100 eligible orders | $156 |
This hypothetical month also tests the formula itself. A slide that says $185 and an export that says $165 aren't in conflict. Label each figure with its numerator, divisor and order statuses before either goes into a leadership update, so a shipping fee or a refund never reads as a change in basket size.
How to Read AOV in BigCommerce Reports
Begin inside the store, not inside a spreadsheet, and work through the sources in order. The sequence matters because each step tells you whether the next one is worth doing.
- Read the overview first. Open store analytics for the date range you care about and read the average next to orders and revenue. If revenue rose while orders held flat, basket size is your explanation before you touch another report.
- Note the exclusion. The Store Overview figure leaves out returns and refunds, so it will not match a net-sales export built later in the same week. Expect the gap and name it in your notes.
- Check customer concentration. Customer reporting shows total spend, order count, last purchase date and customer-level average. A high store figure with modest customer figures means a few large buyers are carrying it.
- Attribute by acquisition source. Marketing reporting calculates channel AOV as revenue from orders attributed to a visit origin divided by orders from that origin, per the Marketing Report documentation. That reveals which sources bring richer baskets rather than merely more visits.
- Export when the built-in view isn't deep enough. Order data carries product line items, shipping, handling, gift wrapping, billing and shipping addresses, taxes and discounts, as the orders overview sets out. The platform recalculates subtotal and total when relevant properties change unless someone overrode them with fixed values, so check for manual overrides before trusting a total.
- Lock one definition in the sheet. For example: gross order total divided by completed orders. Then hold the filters steady across date range, order status, tax treatment, shipping, discounts and customer group.
- Compare only inside that definition. Categories, products, SKUs and variants are fair game once the filters are frozen. Mix two definitions and the differences you find belong to the filter, not the merchandise.
The first few moves cover most day-to-day questions.
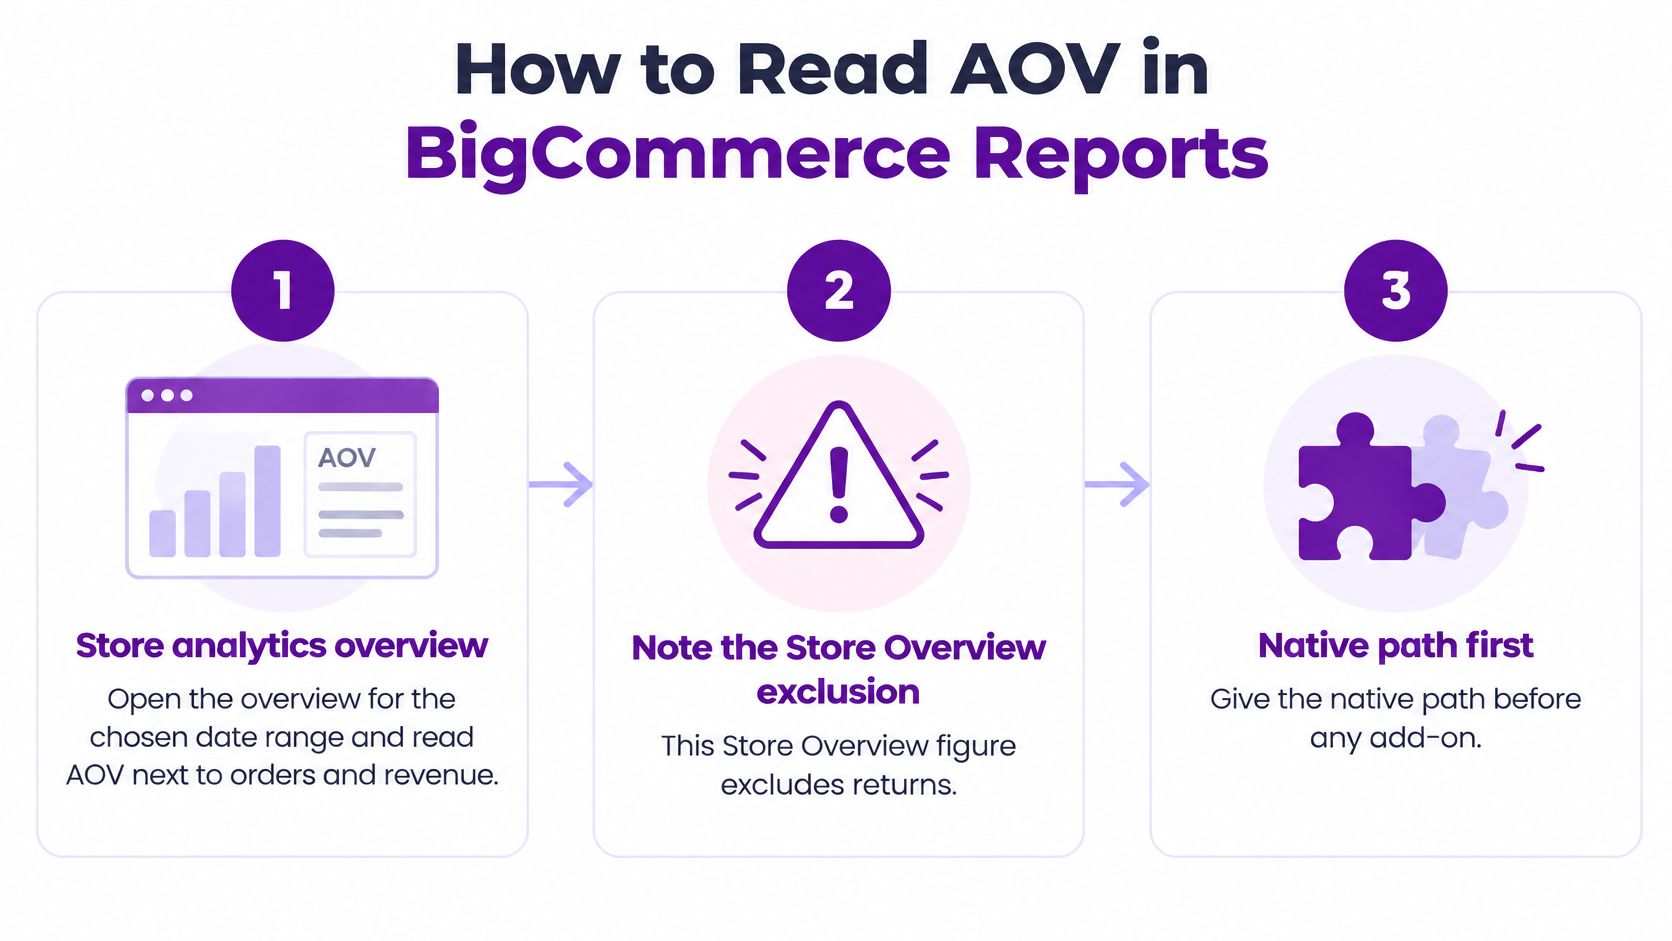
Keep four reporting sources distinct in your head and in your notes: native BigCommerce Analytics, BigCommerce Insights, order exports, and a third-party reporting app. BigCommerce does give you an average order value figure, and it's a legitimate one. A reporting app earns its place when the same specific question keeps coming back, such as monthly sales by category including discounts and refunds, or September against August by SKU. If you're mapping which store events feed which metric before you change anything, this overview of ecommerce tracking capabilities is worth reading first.
Record the export settings with the file, in the file name or a notes tab: statuses, date field, tax setting. A later export run on different statuses won't match an earlier figure even though the store looks identical. Before you divide anything, confirm the revenue column matches the definition you locked, then check one order by hand against the admin screen.
Benchmarks Worth Using and Ones to Ignore
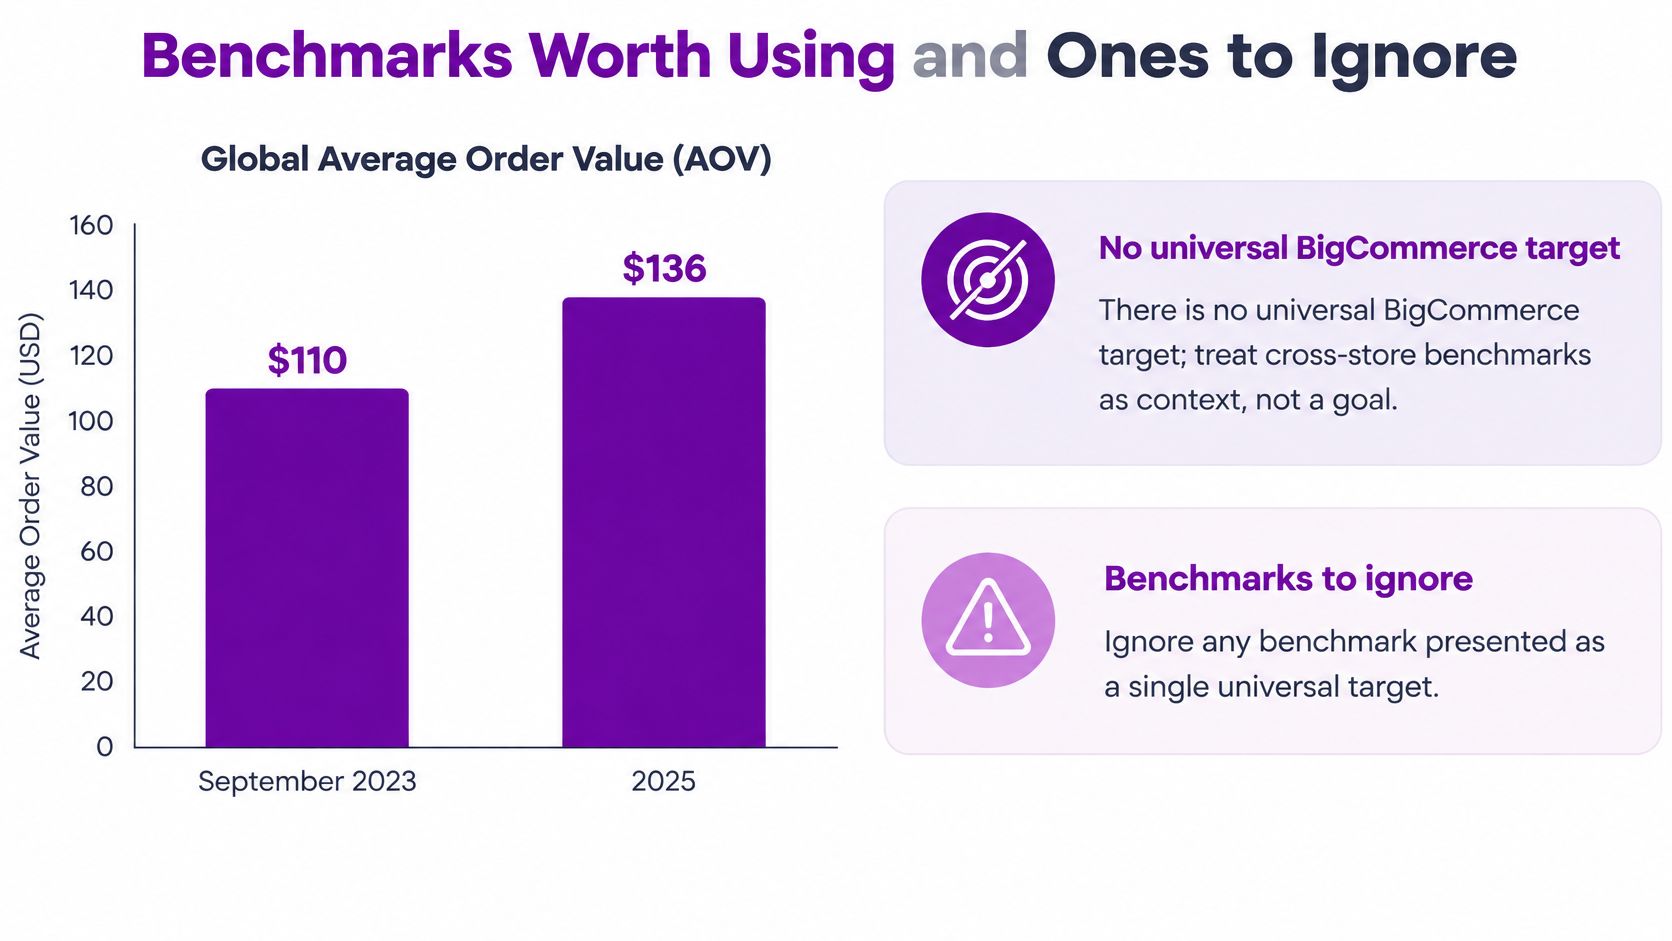
Nothing out there is a BigCommerce target you're obliged to hit. A BigCommerce guide to average order value cites a cross-store benchmark that placed global AOV above $110 in September 2023, and a 2025 benchmark reporting a global average of approximately $136, with about $198 for the Americas, $151 for the United States, $132 for Asia-Pacific, and $128 for Europe and EMEA.
| Benchmark | Figure | How to use it |
|---|---|---|
| Global, September 2023 | Above $110 | Context only, from a benchmark BigCommerce cited |
| Global, 2025 benchmark | About $136 | Not a target for every store |
| Americas, 2025 | About $198 | Region, not a category goal |
| United States, 2025 | About $151 | Only loosely relevant to similar US stores |
| Asia-Pacific, 2025 | About $132 | Currency and mix differ |
| Europe and EMEA, 2025 | About $128 | Same caution as other regions |
| Luxury and jewelry | Can exceed $400 | Category extreme, not a norm |
| Food and beverage | Near $40 | Category extreme, not a failure line |
| Your store, rolling 28 days | Your own figure | Primary short baseline |
| Your store, trailing 12 months | Your own figure | Smooths a few large orders |
Category swings dwarf regional ones. Luxury and jewelry can pass $400 in the same kind of benchmark where food and beverage sits near $40. A store selling cases of drinks that chases $136 is aiming at a number built for a different catalogue.
Set two internal baselines on the identical formula: a rolling 28-day average and a trailing 12-month average. A short window can be lifted by a handful of large orders, which is exactly why the 12-month line stays on the dashboard all year. When the two diverge, split the gap into item count, unit price, discount rate and product mix before you explain it to anyone. Tax-inclusive totals and mixed currencies make another store's dollar figure even less comparable to yours.
Practical rule: a percentage change against your own prior period travels better than a dollar average borrowed from someone else's catalog.
If a team needs a stretch goal, set it from your own prior quarter on the same formula and say so in the report title, so nobody mistakes it for an industry figure.
When a Higher Average Is Not Better
BigCommerce reported that merchants saw an 11% year-over-year increase in average order value during fiscal 2024, while total orders rose 13% over the same period, according to the company's fiscal-year announcement. That's a platform-wide percentage spanning very different categories, geographies and currencies, which is why it's more portable than any single dollar average. It also makes the point that growth came from both more orders and larger ones.
Run the same four tests on your own store, in the same order, every time.
- Orders. Revenue rising while orders hold flat means basket size explains the gain. Orders rising faster than revenue means the average fell.
- Mix. An average lifted by one expensive SKU or variant isn't broad improvement until category and variant totals agree.
- Refunds. An average rising alongside refund dollars means checkout value grew while kept sales may not have.
- Customers. A high store figure with most customer-level figures well below it points to a small set of large buyers.
Repeat those four by region and by acquisition channel, since channel-level averages show whether a source brings richer baskets or just more visitors. A rise counts as a win only after it clears all four. A bigger basket also isn't a bigger margin, so keep the two views separate and read gross margin before crediting an offer with the result.
Practical Ways to Raise Average Order Value
Every lever below shows up in your next report, on the same formula and the same statuses as your baseline month. Pick one, run it, and let the number decide.
Bundles and multipacks add a second unit rather than a second visit. A free-shipping threshold set just above your current merchandise average asks the shopper for one more real product, not a fee that only inflates an order total. Cart prompts that offer a higher-priced variant or a relevant add-on change the mix, so the follow-up question is variant net sales, not the store average alone. Volume or tiered discounts can lift units while cutting the shopper-paid total, which is why discount dollars stay visible next to the average.
None of these is a profit result. This view has no cost data, and discounts, refunds, shipping and tax can all move while margin moves the other way. Judge each test on the same window, statuses and formula as the baseline month, with the prior period as the control.
Useful questions to bring to the report: which product variants generated the most net sales last month, which categories changed after the threshold went live, and whether returning customers, not just new buyers, built larger baskets. Bundles move units per order first, so track that alongside the average instead of waiting for the blended figure to explain it.
If you want a structured path from traffic to repeat purchase before you commit to a test, this data-driven framework for online revenue is a useful map.
Skip the advice that every store needs a popup. Choose one test for this month and settle it on two numbers only: the average order value and net sales after refunds. If a new bundle's refund dollars climb, the Store Overview figure can improve while net sales don't.
Build a Repeatable AOV Report
The next step is one saved comparison, not a new dashboard. Use shopper-paid merchandise after discounts as the numerator, and keep refunds, refunded tax and sales tax in their own columns. Compare last month with the month before, by category and by SKU, on the same order statuses and tax treatment both times.
The native route works like this. Read the headline figure in Store Overview, then pull an order export when you need category or variant detail, applying the same filters to every period. A spreadsheet handles this fine if someone rebuilds it carefully each month and records the settings.
Chartsy's BigCommerce analytics, which starts at $19 per month, takes a different route: ask a question in plain English, such as "Show monthly sales by category, including discounts and refunds" or "Compare September and August sales by SKU", and get the chart back to save. Recurring analyses are kept as a custom BigCommerce report rather than rebuilt from exports, and the same workspace answers follow-up questions about products, customers and refunds.
Read the result as sales performance, not profit, and don't expect advertising attribution or inventory forecasting from it. Once the two-month category view is saved, run one basket test, a bundle or a shipping threshold, and judge it on the average and net sales together, with the prior month as the control.
Chartsy turns BigCommerce order data into reports you can ask for in plain English, covering sales, products, SKUs, customers and refunds, then keep as dashboards instead of rebuilding a spreadsheet every month. Start with the two-month category comparison described above, then add one basket test and judge it on average order value and net sales together. Visit Chartsy to connect your store and run the first report.

Written by
Chartsy TeamAnalytics team at Chartsy
The Chartsy Team writes guides, product updates, and resources to help SaaS and eCommerce founders make sense of their metrics, without SQL or spreadsheets.
Chartsy