
A promotion ends, and your BigCommerce dashboard shows a sales total higher than last month. But did customers buy more, did coupons change the mix, are refunds still coming in, or is tax included? A BigCommerce sales report is useful only when the figures are clearly defined and tied to a date range and order rules.
The practical deliverable is a dated view of completed-order outcomes with separate columns for sales, discounts, refunds, tax, shipping, and order count. It's a way to understand store performance, not a profit report.
Table of Contents
- What Each Sales Number Actually Counts
- Where to Open the Sales Report
- Why a Higher Total Can Still Be Worse
- Sales by Product SKU and Variant
- Customers States and Period Comparisons
- Five Sales Questions and One Report to Run This Week
- Store Credit and Discount Codes in Sales Reports
What Each Sales Number Actually Counts
Take one order: $120 in merchandise, a $20 coupon, $8 in tax, and a $30 refund later. Each amount answers a different question. The coupon lowers merchandise value, the refund reverses part of the original sale, and tax is collected on the order rather than earned from products. If the refund applies to merchandise, net sales are $70: $120 minus $20 minus $30.
The timing matters too. If the order and refund fall in different reporting periods, the sales total for each period changes even though only one customer order is involved.
Keep these figures separate
| Figure | What it counts | Do not treat it as |
|---|---|---|
| Gross sales | Merchandise value on included orders before discounts and refunds | Cash collected or profit |
| Discounts | Coupon, promotion, or catalog price reductions | Store credit, tax, or shipping, which need separate treatment |
| Refunds and returns | Amounts reversed after the original order | A reason code unless the export actually contains one |
| Net sales | Merchandise value after discounts and refunds | Profit, since product cost is not in the sales total |
| Tax | Tax charged on included orders | Revenue earned by the store |
| Shipping | Shipping charged to the customer | Product demand or margin |
| AOV | The chosen sales figure divided by order count for the same date range and status rules | A comparable figure if one period uses gross and the other uses net |
| Order count | Included orders after status filters | Visitors or conversion rate |
Net sales always means product value after discounts and refunds in this report. State whether every sales and AOV figure uses gross or net. A higher total can come from deeper discounts, store credit used at checkout, tax in a mixed total, or one unusually large order, so compare it with discounts, refunds, tax, and order count before calling demand stronger.
BigCommerce order records separate merchandise value, tax, and shipping. A custom export can keep those components in distinct columns, making the final order total easier to audit and preventing tax or shipping from being mistaken for merchandise sales.
Practical rule: Name the metric in the column header, not just in the report title.
A useful export might label columns “Merchandise before tax,” “Discount,” “Refund,” “Tax,” and “Net sales after discounts and refunds.” For guidance on selecting measures that fit a reporting goal, see choosing KPIs for your marketing dashboard. Consistent labels make periods and reports easier to compare.
Where to Open the Sales Report
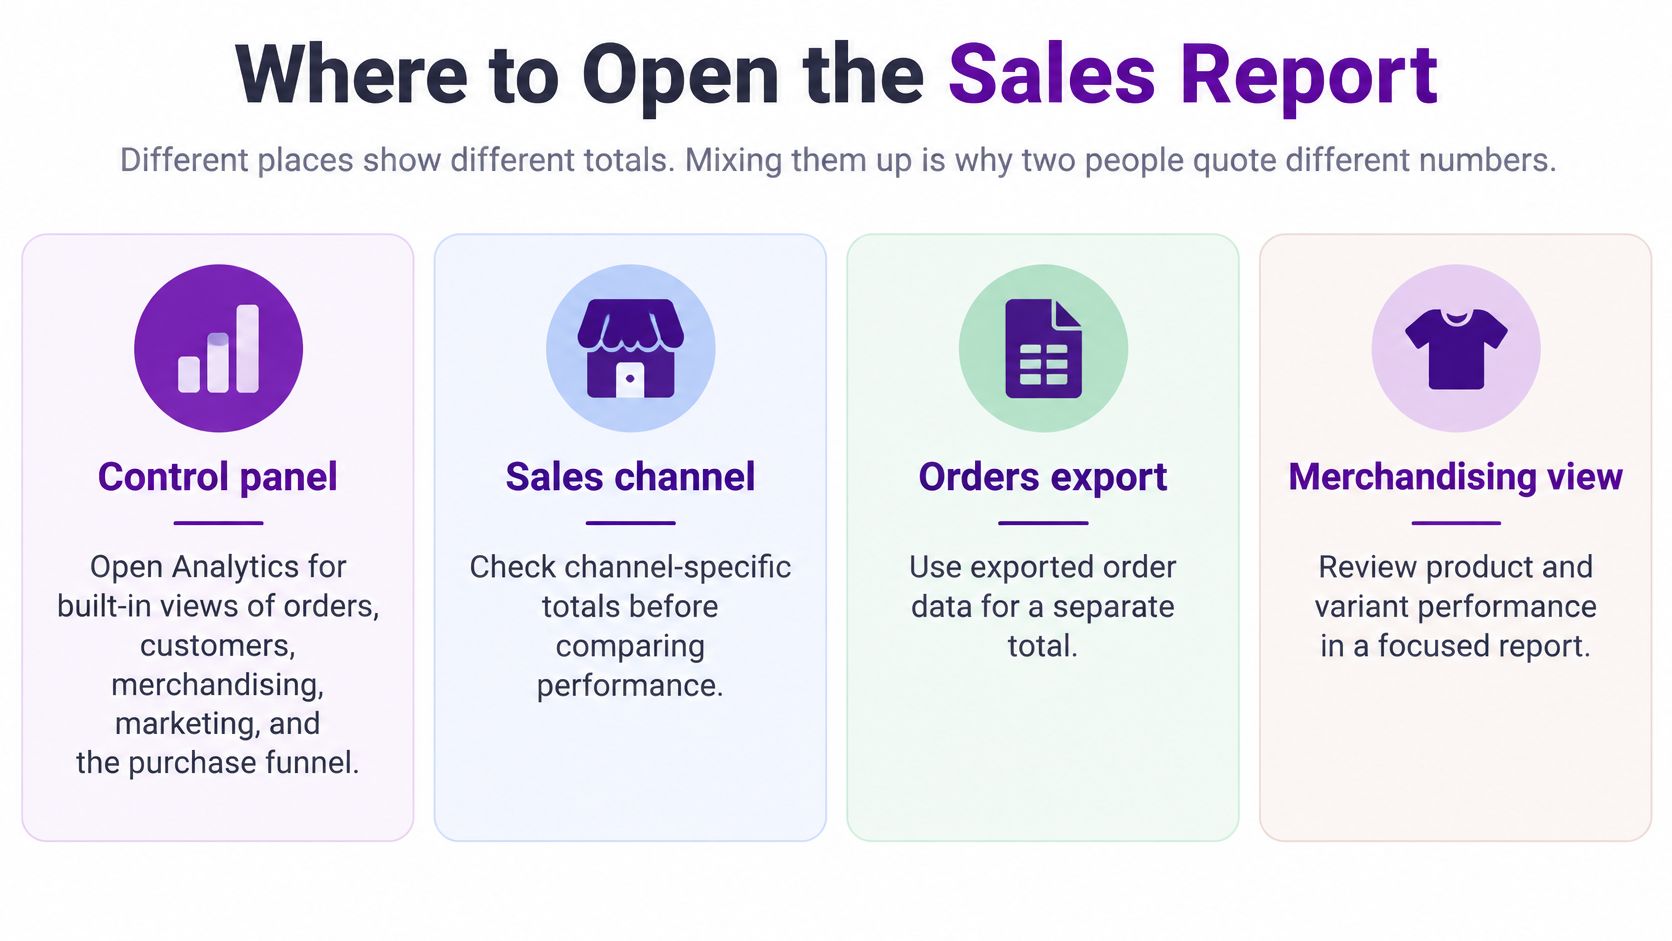
There are several places to inspect sales, and mixing them up is a common reason two people quote different totals. Start in Control Panel > Analytics for built-in views of orders, customers, merchandising, marketing, and the purchase funnel. If the store sells through multiple channels, use the sales-channel filter when the view provides it, and keep channel scope consistent when comparing totals.
Choose the route that matches the question
- Analytics: Use the control-panel charts and summary reports to check store, channel, customer, order, or merchandising performance at a glance.
- Insights: Use BigCommerce Insights for a short, guided summary that addresses a question already covered in the admin. Treat it as a summary, not a line-level sales file.
- Order export: Export order records when you need row-level detail such as SKU, variant, discount, refund, tax, or a specific date range that a chart doesn't split out.
- Reporting app: Add a reporting tool when you need to save a set of filters and columns, repeat the same question, or create a report without rebuilding a spreadsheet.
BigCommerce does have sales reporting. The practical limitation is that a built-in chart may not provide the exact combination of columns and filters a particular operational question requires. An order export gives you rows to inspect; a reporting app can help make a custom report repeatable.
| Place | Best for | What you get | Limit to watch |
|---|---|---|---|
| Analytics | Store, channel, order, customer, and merchandising overviews | Charts and summary reports in the control panel | Less control over custom columns and unusual date splits |
| Insights | A short question BigCommerce can already summarize | Guided insight inside the admin | Not a full line-level sales file |
| Order export | SKU, variant, discount, refund, tax, and status detail | A CSV you can filter | Easy to mix statuses, currencies, or tax into one total |
| Reporting app | Saved filters, repeat questions, and shared reporting workflows | A report you don't rebuild every month | Only as useful as the order fields it can read |
Whichever route you use, set an explicit order-status rule before comparing totals. For example, decide whether to exclude cancelled orders and incomplete checkouts. BigCommerce webhooks can report order-created events for incomplete orders, so an event notification shouldn't automatically be counted as a completed sale; the BigCommerce webhook overview explains why order details need to be checked. When totals still look surprising, the next question is what the number says about store performance.
Why a Higher Total Can Still Be Worse
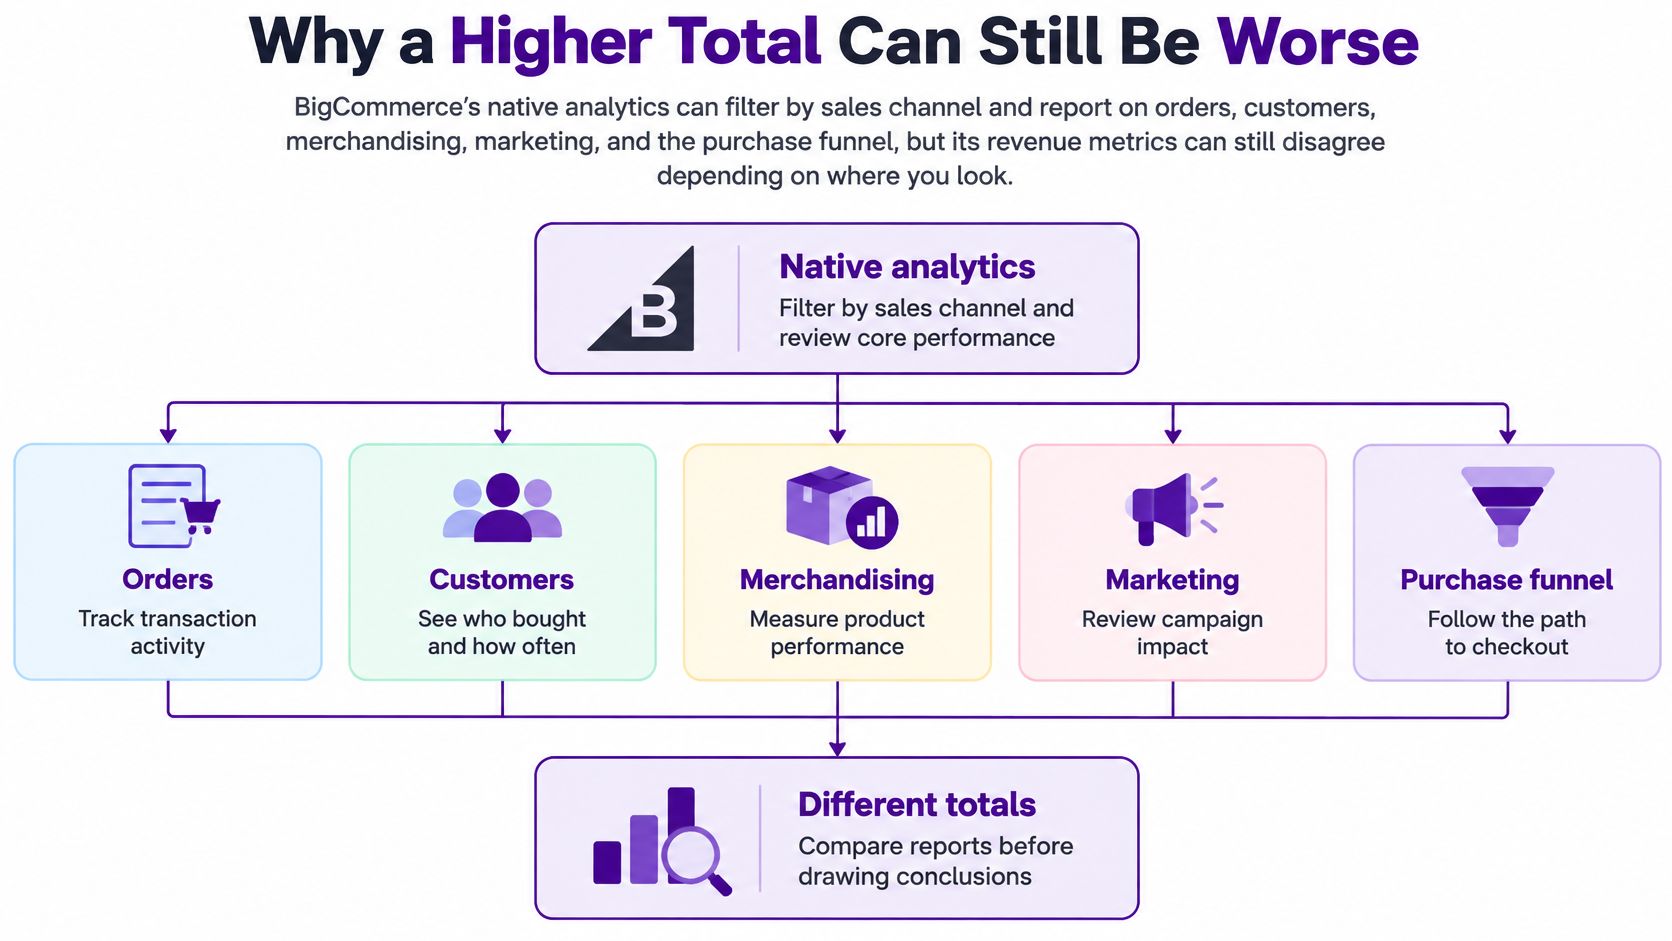
A higher sales total can mean a weaker month. BigCommerce Analytics can filter by sales channel and report on orders, customers, merchandising, marketing, and the purchase funnel, yet its documented revenue metrics track the amount paid by the customer. That figure leaves out payment-provider fees, later refunds, chargebacks, fulfillment costs, and contribution margin. The BigCommerce Analytics reporting guide draws the line clearly: a sales report is not automatically a profitability report.
Reconcile the total before judging it
A worked example makes the gap concrete: a sitewide coupon attracts a wave of first-time orders, gross sales rise 12%, refunds increase, and net sales barely move. The higher gross figure shows more merchandise moved before refunds. It says nothing about how much product value survived discounts and refunds, and nothing about whether the store made a profit.
Use the same check order every time:
- Confirm the date range and timezone. Every report in a comparison must cover the same period.
- Confirm included order statuses. Apply the same rules to every comparison.
- Subtract discounts. Keep coupon and promotion reductions distinct from merchandise value.
- Subtract refunds. Include refunds recorded for the period under the report's stated method.
- Split out tax and shipping. A tax-inclusive order total is not net sales.
Store credit needs attention too. Native revenue metrics don't treat store credit as a discount, so a month with substantial store-credit use reads differently from one driven by coupon codes. A revenue figure is also not cash deposited: processing and other costs sit outside that total.
Profit is a separate question. Margin math requires cost data that order reporting does not contain; the best margin calculators for Shopify sellers shows how stores on that platform handle the calculation, and BigCommerce merchants need the same cost inputs wherever they keep them. Keep the sales figure grounded in the order data you can verify, and check how net sales are defined when deciding how to label it.
At the end of the reconciliation, a bookkeeper should be able to tick off three lines:
- Orders in range, under the stated status rules
- Adjustments, including discounts and refunds
- Labeled net sales, product value after discounts and refunds
Sales by Product SKU and Variant
A product page can look popular while one particular size, color, or other variant accounts for most of its sales. Start with the merchandising view to understand which products and categories are moving, then use order data when the question needs a SKU, variant, discount, or refund breakdown. A SKU, or stock keeping unit, is the identifier used to distinguish a specific product or variant in the catalog.
For a last-month report, keep columns for product name, SKU, variant, category, quantity, gross line amount, discount, refund, tax, and net sales. Set the date range and order-status rules as filters. Rank variants by net sales, product value after discounts and refunds, rather than by units alone: a lower-priced variant could sell more units but contribute less net sales.
Make the comparison useful to merchandising
Say a jacket has three SKUs for different sizes. A product-level total can hide which size sold, while a category total can hide whether one variant generated most of the category's sales. A second report, monthly sales by category with gross sales, discounts, and refunds in separate columns, helps show whether a promoted category's higher gross figure remains strong after adjustments.
If the same SKU sells through more than one sales channel, filter to one channel or split the results by channel before combining rows. Otherwise, the report may obscure which channel contributed the sales. For a focused view of store, category, product, and SKU performance, use a product performance analytics report.
A cart can help explain what a shopper selected, but it isn't the right source for a finished sales report. BigCommerce's Cart API documentation describes carts as containing products, prices, and discounts, but not customer-related data. Use completed order records for sales, and join customer data only when the report needs customer analysis.
Don't label a SKU's sales as profit unless you have verified product costs and the report uses them. A useful question to take into a reporting tool is: “Which product variants generated the most net sales last month?”
Customers States and Period Comparisons
Product reports show what sold. Customer and period reports help show who bought and whether performance changed under a consistent comparison. Define a new customer as someone whose first included order falls within the reporting period, and a returning customer as someone with an earlier included order. Cart data can't establish either status, so base the distinction on customer and order records.
To answer “Which customers made more than one purchase this year?”, filter the year and included order statuses, then count distinct orders by customer ID. For “Show sales and refunds by customer state,” use the shipping or billing state field that your export contains, and label which one you used. BigCommerce order data can provide a USD-converted inclusive-tax amount through usdIncTax, but preserve the original currency and amount as well; the BigCommerce order API reference documents the converted field.
Compare periods on equal terms
For “Compare September and August sales by SKU,” use the same metric and status rules for both months. A practical table has one row per SKU, columns for each month's net sales, order count, and refunds, and a change column. Net sales in each month should mean product value after discounts and refunds, not a mixture of gross in one month and net in the other.
BigCommerce reported that its customers' sales on Thanksgiving Day and Black Friday in 2023 increased 9% compared with the same days in the prior year on a same-store basis. That figure is an aggregate for those days, not a forecast for your store. The BigCommerce Thanksgiving and Black Friday report illustrates a sound comparison method: use equivalent calendar dates, keep the store population consistent, and name the metric being compared.
Check orders and AOV beside sales when evaluating a promotion or seasonal period. AOV, average order value, is sales divided by order count, so label whether it uses gross or net sales. For state-level comparisons across currencies, don't add local amounts together as if they shared a unit; retain the transaction currency or use a clearly labeled normalized value.
Five Sales Questions and One Report to Run This Week
| Question | Native route first | Reporting-tool shortcut |
|---|---|---|
| Which product variants generated the most net sales last month? | Merchandising view for direction, then an order export grouped by variant with discounts and refunds | Ask one plain-English question if the tool has variant and refund columns |
| Monthly sales by category, including discounts and refunds | Category view plus an export with separate gross, discount, and refund columns | Save a category report with the same three money columns |
| Which customers made more than one purchase this year? | Order export counted by customer ID after status filters | Save a customer report grouped by order count |
| Compare September and August sales by SKU | Two filtered exports with identical status rules | Save a side-by-side SKU comparison with a change column |
| Sales and refunds by customer state | Export with the state field and refund amounts, split by currency if needed | Save a state report with refund columns |
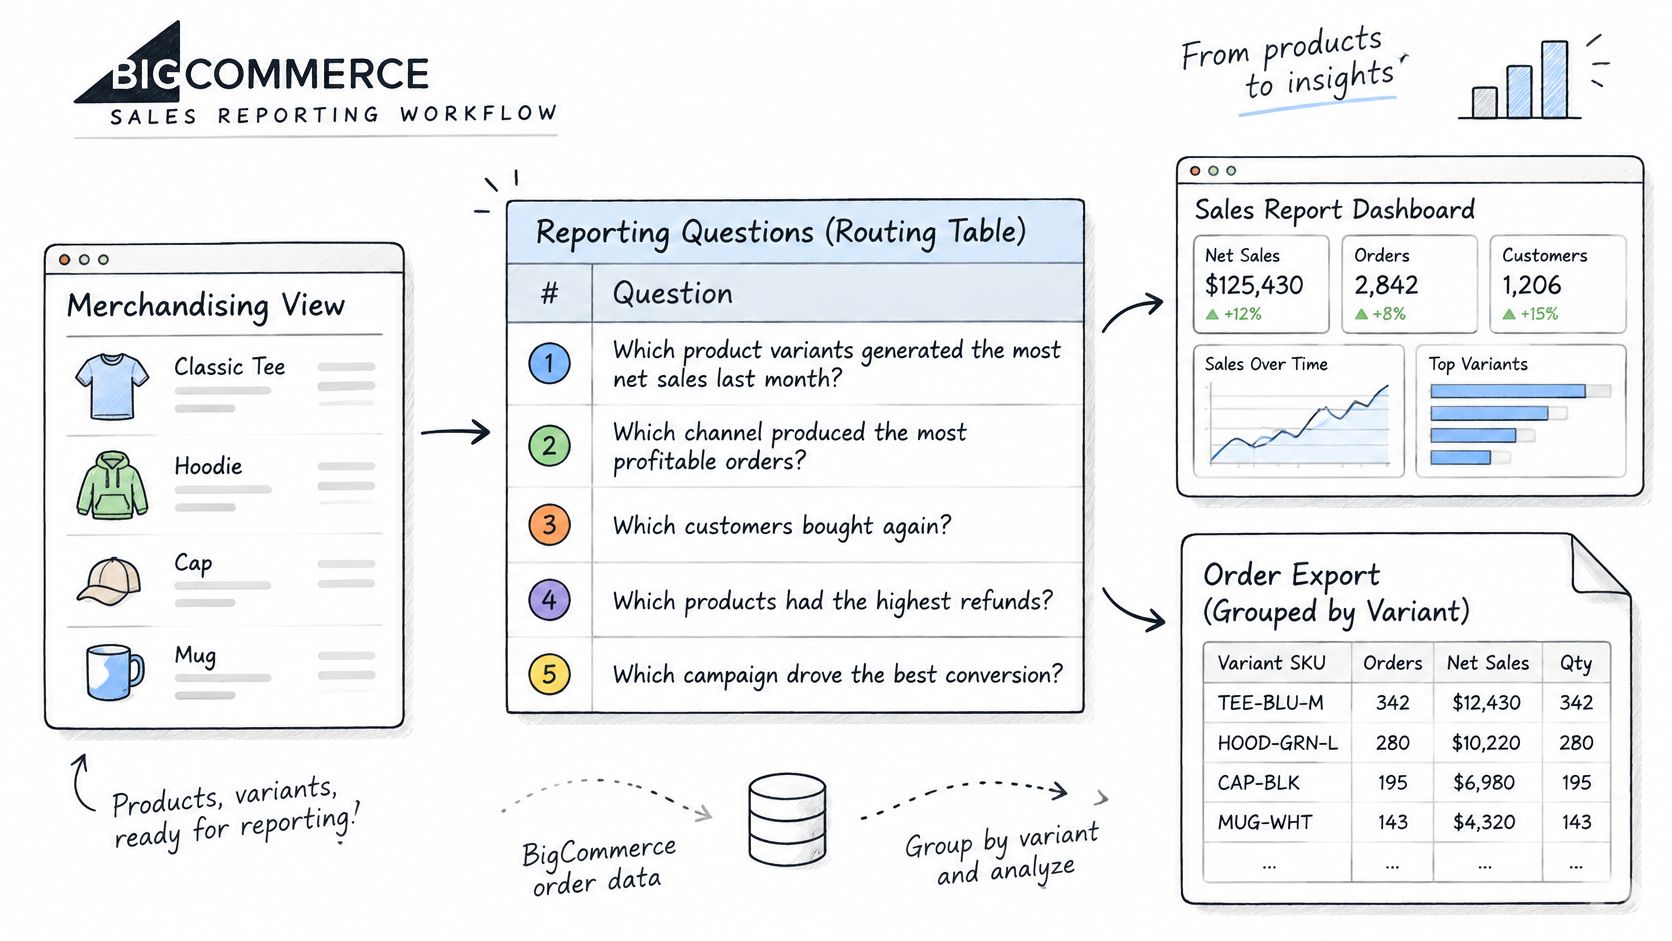
The native route is a good starting point for a quick answer. If you need the same columns and filters every month, a reporting tool can reduce spreadsheet rebuilding. Chartsy lets merchants ask questions in plain English, see charts, and analyze revenue and product performance at store, category, product, and SKU levels. Its BigCommerce reporting exports to PDF or PNG, which can be useful when sharing a finished view.
For example, start with “Which product variants generated the most net sales last month?” Set the date range, exclude incomplete and cancelled orders unless there's a reason to include them, and check that the report separates gross sales, discounts, refunds, tax, and net sales. Compare its net-sales total with the labeled order export before you stop maintaining a separate spreadsheet.
The BigCommerce Pro plan starts at $19 per month billed monthly or $190 per year billed yearly, with a 14-day free trial, no credit card required, and cancellation anytime. The right first report is the one tied to a decision you need to make, such as whether a promoted category's sales held up after refunds.
This video offers another look at the reporting workflow.
Store Credit and Discount Codes in Sales Reports
A coupon and store credit can both affect what a customer pays, but don't assume they appear as the same kind of adjustment in a report. BigCommerce's documented revenue metrics don't treat store credit as a discount. That means a report using native revenue figures may present store-credit orders differently from orders reduced by coupon codes.
Keep the two cases visible in your review. Look at the discount amount or code when the order includes a promotion, and check how the payment was applied when store credit is involved. Don't use a discount column as a proxy for every reason the amount paid differs from the merchandise value.
Make discount comparisons more useful
When comparing campaigns, use the same date range and order-status rules, then keep gross sales, discount amounts, refunds, and net sales in separate columns. Net sales here means product value after discounts and refunds. If the report groups orders by code, also check whether customers used multiple offers or whether some orders had no code; otherwise, the coded orders may not represent the full promotion period.
A discount rate can help summarize how much a discount reduced eligible sales, but its meaning depends on the formula and denominator used. Label the calculation in the report rather than comparing percentages built from different bases. For a focused explanation of the metric, see discount rate.
Store credit also isn't proof that the store collected the same amount in new cash. Keep the order's sales information and payment details distinct when reviewing what happened. If a higher gross figure coincides with more discounts or store-credit use, inspect the underlying orders before calling it stronger demand or better performance.
Choose one question to answer first, such as net sales by product variant for last month, and set its date range and order-status rules before sharing the report. Chartsy helps BigCommerce merchants analyze sales and product performance with plain-English questions and exportable reports; visit Chartsy to see whether that workflow fits your store.

Written by
Chartsy TeamAnalytics team at Chartsy
The Chartsy Team writes guides, product updates, and resources to help SaaS and eCommerce founders make sense of their metrics, without SQL or spreadsheets.
Chartsy